
Driven, at least in part, by the huge increase in the potential for remote work, US residents moved in large numbers to states with lower urban densities in the two years and three months (27 months) between the 2020 Census (April 1) and the 2022 Census Bureau population estimates. The date of the Census was also nearly the same as the start of the Covid pandemic, during which working from home increased substantially.
During these 27 months, an annualized average of 1,111,000 residents moved across state lines in the United States. This is an increase of 64% relative to the annual average net domestic migration of 679,000 between states during the previous decade. 2010s. The average urban density in the United States was 2,544 per square mile in 2020, according to the Census.
Moving to States with Lower Urban Population Densities
US residents overwhelmingly moved to states with lower urban population densities (See Note: Urban Population Densities). Summarized, the states with urban densities below 3,000 per square mile gained 1.86 million net domestic migrants, while the states (and DC) with urban densities of 3,000 and above lost 1.86 million net domestic migrants. The net gain for the states below 3,000 urban densities was 3.72 million in relation to the states with urban densities of 3,000 and over.
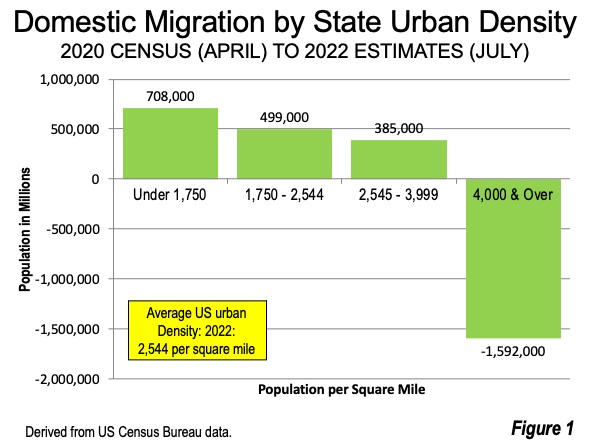
Among the states with the lowest urban densities, below 2,000 persons per square mile, there was an increase of 867,000 net domestic migrants from higher density states and the District of Columbia (DC).
States with urban densities between 2,000 and 2,499 per square mile gained a net 340,000 net domestic migrants from higher density states and DC.
States with between 2,500 and 2,999 persons per square mile gained 654,000 net domestic migrants from the higher density states and DC.
States with between 3,000 and 3,999 persons per square mile lost 269,000 net domestic migrants from the higher density states and DC.
The states (and DC) with urban densities of 4,000 and higher lost 1,592,000 net domestic migrants to the states with states with lower urban densities. This category includes California, New York and Hawaii along with the District of Columbia (Figure 1).
States with the Largest Net Domestic Migration Gains
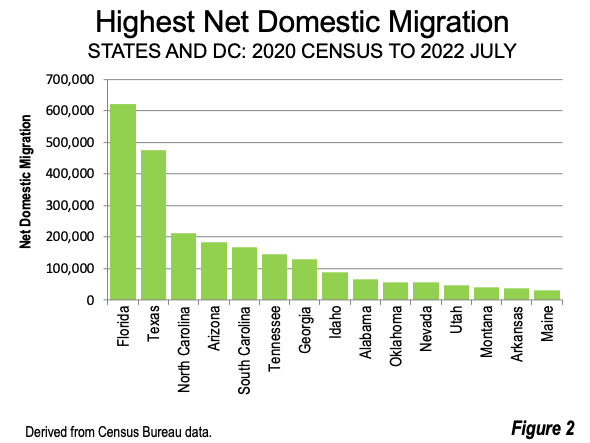
Among the 10 states gaining the most net domestic migration, eight were in the South. These included top ranked Florida, which gained 622,000 net domestic migrants, followed by Texas at 475,000. North Carolina gained 212,000. South Carolina gained 166,000, Tennessee gained 146,000 Georgia gained 128,000 net domestic migrants. Two other Southern states are new to top rankings in net domestic migration, including Alabama, which gained 65,000 net domestic migrants, and Oklahoma, which gained 57,000. In both cases, the 27 month net domestic migration gain was well above the total 2010-2020 net domestic migration.
Two states in the top ten were from the Mountain West, Arizona, which gained 182.000 and Idaho, at 89,000 (Figure 2).
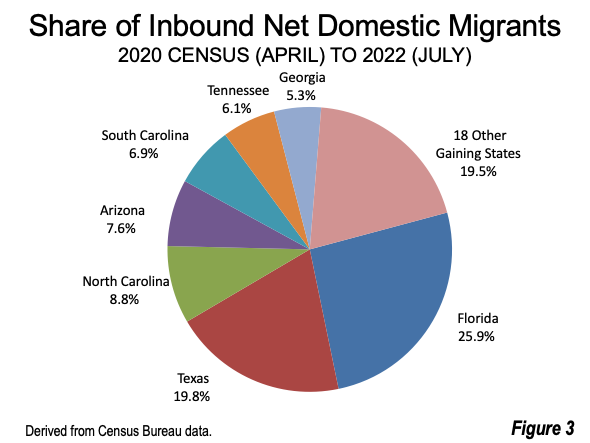
The eight states that gained over 100,000 net domestic migrants accounted for 80.5% of net migration gains. Florida accounted for more than one-quarter of net domestic inbound migration (25.9%) and Texas nearly one-fifth (19.8%). Other states exceeding 100,000 net domestic migration, included North Carolina, 8.8% of net inbound state domestic migration, Arizona 7.6% South Carolina 6.9%, Tennessee 6.1% and Georgia 5.3%. The other 18 gaining states accounted for 19.5% of the moving destinations (Figure 3).
States (& DC) with the Largest Net Domestic Migration Losses
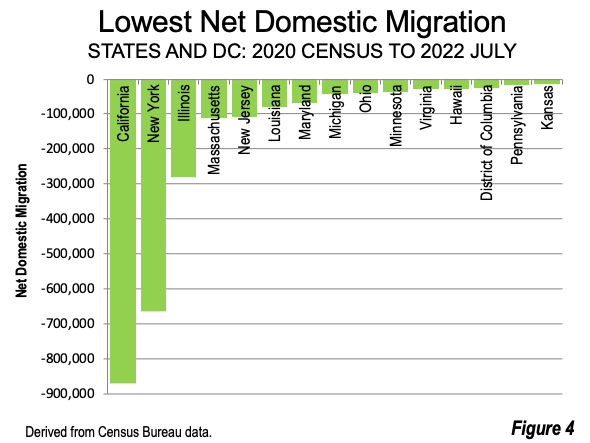
By far the biggest net domestic migration loser was California, with a net domestic migration loss of 871,000 over the 27 months. This is more than the population of the city of San Francisco which according to the latest Census Bureau estimate is 808,000 residents. This huge outflow of people, along with other factors, prompted the California Department of Finance to issue interim population estimates showing that, over the 2020-2060 period, the state is expected to suffer a small population loss. Previous state projections have been as high as 60 million. California has the highest urban population density of any state at 4,800 per square mile.
New York ranked second in net domestic migration losses at 665,000, and has the second highest average urban density, at 4,600 per square mile. The above 4,000 urban density category also includes Hawaii and the District of Columbia (DC). DC has a higher urban density than any state, at 11,300. However, DC is 100% urban (virtually no rural land) and is entirely a dense urban core. This is in contrast to states, all of which all have far more rural than urban land (Figure 4).
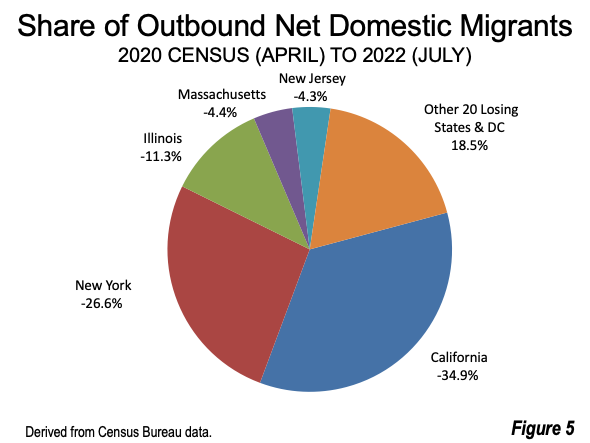
The states suffering net out migration exceeding 100,000 accounted for 81.5% of the total net migration losses. California alone accounted for more than one-third of net outbound moves (34.9%), and New York for more than a quarter (26.6%). Other leading domestic migration losses were in Illinois at 11.3%, Massachusetts at 4.4% and New Jersey at 4.3%. The other states losing net domestic migrants and the District of Columbia accounted for 18.5% of the losses (Figure 5).
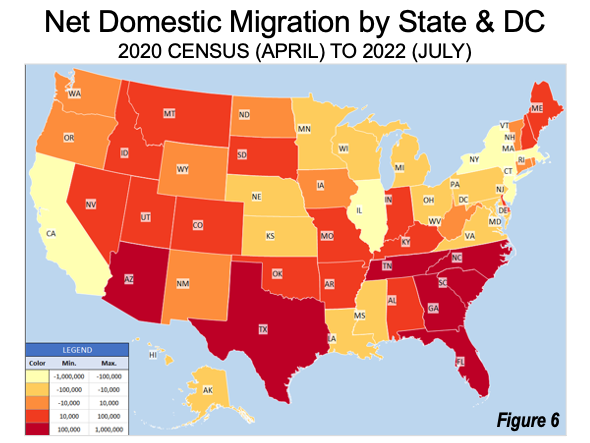
Net domestic migration for the states is illustrated on a map (Figure 6). The strongest gains were 10 adjacent states of the South (with extensions reaching Indiana and Missouri) and in six adjacent Mountain West states, with an extension reaching South Dakota. Maine and New Hampshire, in the Northeast, form another adjacent area of strong net domestic migration.
The new data shows that the historic dispersion to lower densities — that have dominated urban for at least the last 75 years in the United States has accelerated. The pattern seems likely to continue, albeit at a more modest pace, in the foreseeable future.
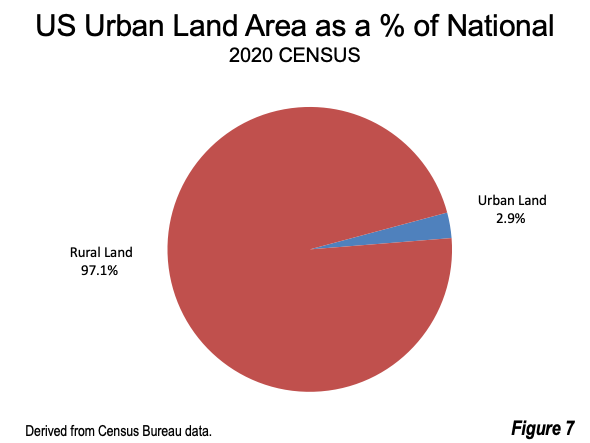
Note: Urban Population Densities: Urban densities are used in this article. About 80% of US residents live in urban areas, which cover only 2.9% of the national land area, according to 2020 US Census data (Figure 7).
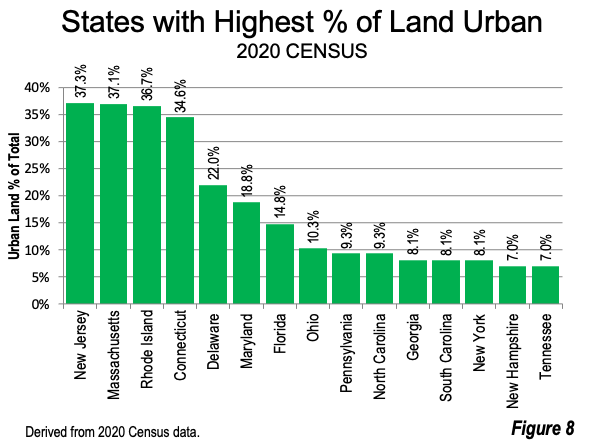
Urban population densities are thus far more reflective of the environments in which people live, than average overall densities would be. Moreover, overall state densities could be misleading. For example, five states ranked in the top 10 in urban density rank far lower in overall density, including Arizona (33rd in overall density), Colorado (37th), Oregon (39th), Utah (40th) and Nevada (42nd). New Jersey has the highest share of its land area in urban areas, at 37.4%, followed closely by Massachusetts, at 37.1%., Rhode Island, at 35.7% and Connecticut, at 34.9% (Figure 8).
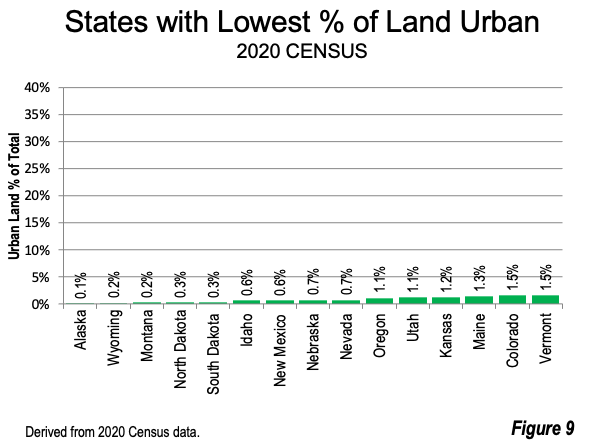
Four more states have more than 10% of their land in urban development (Delaware, Maryland, Florida and Ohio). Fifteen states have 1.5% of their land in urban areas (Figure 9).
Wendell Cox is principal of Demographia, an international public policy firm located in the St. Louis metropolitan area. He is a founding senior fellow at the Urban Reform Institute, Houston, a Senior Fellow with the Frontier Centre for Public Policy in Winnipeg and a member of the Advisory Board of the Center for Demographics and Policy at Chapman University in Orange, California. He has served as a visiting professor at the Conservatoire National des Arts et Metiers in Paris. His principal interests are economics, poverty alleviation, demographics, urban policy and transport. He is co-author of the annual Demographia International Housing Affordability Survey and author of Demographia World Urban Areas.
Mayor Tom Bradley appointed him to three terms on the Los Angeles County Transportation Commission (1977-1985) and Speaker of the House Newt Gingrich appointed him to the Amtrak Reform Council, to complete the unexpired term of New Jersey Governor Christine Todd Whitman (1999-2002). He is author of War on the Dream: How Anti-Sprawl Policy Threatens the Quality of Life and Toward More Prosperous Cities: A Framing Essay on Urban Areas, Transport, Planning and the Dimensions of Sustainability.
Photo: by DXR, State Capitol buildings, Florida. Florida had by far the highest net domestic migration in the nation from the 2020 Census to the July 2022. via Wikimedia, CC 4.0 License.


