
Demographia United States Housing Affordability rates middle-income housing affordability in 174 major housing markets in the United States. This edition covers the third quarter (September quarter) of 2022.
Assessing Housing Affordability:
Sometimes housing affordability is evaluated by simply comparing house prices. However, without consideration of incomes, housing affordability cannot be assessed with any real meaning for potential buyers. The very term housing “affordability” implies a relationship between housing costs and the ability to pay (or incomes).
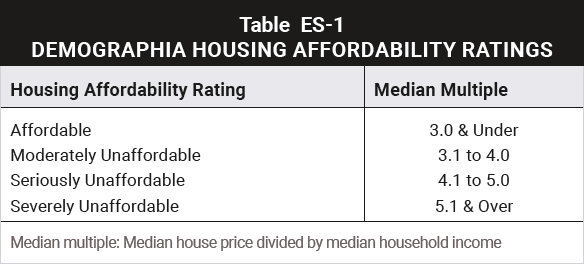
Demographia United States Housing Affordability uses the “median multiple” to rate middle-income housing affordability. The median multiple is a price-to-income ratio, which is the median house price divided by the gross median household income (pre-tax).
Middle-income housing affordability is rated in four categories (Table ES-1):
 Housing markets are metropolitan areas, which are also labor markets. In a well-functioning market, the median priced house should be affordable to a large portion of middle-income households, as was overwhelmingly the case a few decades ago.
Housing affordability comparisons are made, (1) between housing markets (such as comparison between Cincinnati and Pittsburgh) or (2) over time within the same housing market (such between years in Cincinnati).
The Demand Shock:
The pandemic and the related dispersion of population have produced a demand shock that has led to an unprecedented deterioration in housing affordability.
U.S. Housing Affordability in 2022:
US housing affordability in 2022 is summarized by market in Table ES-2.
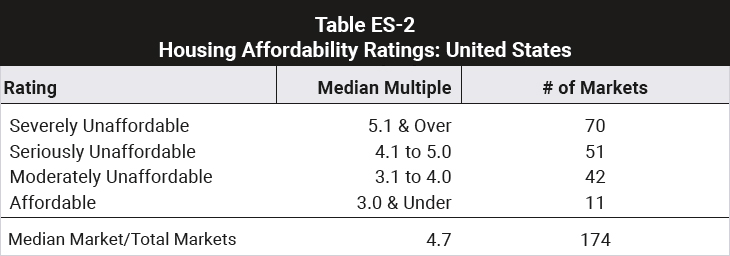 The number of markets rated “affordable” improved to 11 from 9 in 2022. Nonetheless, this is much less than 44 in 2019, before the demand shock. The most affordable markets were Utica-Rome, NY (2.0), Peoria, IL (2.4), Scranton, PA (2.6), Davenport, IA-IL and Youngstown, OH-PA (2.7), Cedar Rapids, IA and Erie, PA (2.8), as well as Canton, OH, Duluth, MN-WI, Rockford, IL and Toledo, OH (2.9).
The number of severely unaffordable markets — defined by median multiples over 5.0 — rose to five times the 14 of 2019 (the last pre-demand shock year), to 70 in 2022.,/p>
Housing Affordability and Land Use Regulation:
Declining housing affordability is driving higher costs of living that threaten the future of the middle-class. In Under Pressure: The Squeezed Middle-Class, the OECD finds that the middle-class faces ever increasing costs of living and that rising owned house prices are the “main driver of rising middle-class expenditure.”
Academic research associates the declining housing affordability over recent decades with stronger land use regulation. In particular, urban containment regulation --- planning orthodoxy --- can produce substantially higher costs. As land available for urban development is severely rationed, prices tend to rise.
In Rethinking Urban Sprawl: Moving Toward Sustainable Cities, OECD concludes that the urban growth boundaries and greenbelts must be accompanied by sufficient land for urban expansion to maintain affordability. This land needs to be competitively priced to keep house prices from rising disproportionately to incomes. Regrettably, this has not been achieved in an expanding number of severely unaffordable markets.
Whatever its advantages, urban containment is associated with higher housing costs, and higher costs of living. Wherever house prices rise faster than incomes, greater inequality of both opportunity and outcomes can be expected. In effect, higher house prices relative to incomes interfere materially with equality of opportunity by putting out of reach housing that would have previously been accessible to middle and lower income households.
Potentially At-Risk Markets: A number of growing markets have become severely unaffordable, especially during the recent demand shock. These include, for example, Reno (median multiple 7.4), Las Vegas (6.9), Boise (6.3), Phoenix (6.0), Tucson (5.9), Provo (5.8), Austin (5.5), Ogden (5.4), Colorado Springs (5.6),Charlotte (5.4+), Nashville (5.3) and Raleigh (5.1). As normal market conditions return, housing affordability could improve in these markets. On the other hand, deteriorated housing affordability may not be restored, if metropolitan land use policies do not ensure a competitive market for land that restores profitable commercial construction of housing for middle-income households.
Urban containment is associated with such effects, which can be characterized as government induced inequality. This has happened, most substantially in California and Hawaii, are also being followed by other major markets such as in Washington, Oregon, Colorado.
Elaboration and sources are in the full report. Click here to read and download the full report.
Wendell Cox is principal of Demographia, an international public policy firm located in the St. Louis metropolitan area. He is a founding senior fellow at the Urban Reform Institute, Houston, a Senior Fellow with the Frontier Centre for Public Policy in Winnipeg and a member of the Advisory Board of the Center for Demographics and Policy at Chapman University in Orange, California. He has served as a visiting professor at the Conservatoire National des Arts et Metiers in Paris. His principal interests are economics, poverty alleviation, demographics, urban policy and transport. He is co-author of the annual Demographia International Housing Affordability Survey and author of Demographia World Urban Areas.
Mayor Tom Bradley appointed him to three terms on the Los Angeles County Transportation Commission (1977-1985) and Speaker of the House Newt Gingrich appointed him to the Amtrak Reform Council, to complete the unexpired term of New Jersey Governor Christine Todd Whitman (1999-2002). He is author of War on the Dream: How Anti-Sprawl Policy Threatens the Quality of Life and Toward More Prosperous Cities: A Framing Essay on Urban Areas, Transport, Planning and the Dimensions of Sustainability.
Photo: Report cover image La Citta Vita via Flickr under CC 2.0 License.


