
The University of Washington Study: Economist Theo Eicher of the University of Washington has published research indicating that regulation has added $200,000 to house prices in Seattle between 1989 and 2006. Eicher told the Seattle Times that “Seattle is one of the most regulated cities and a city whose housing prices are profoundly influenced by regulations.”
Not surprisingly, this caused consternation in the planning community, which would prefer to minimize or dismiss any negative consequences of planning regulations on housing affordability.
The Washington Chapter of the American Planning Association (W-APA) published a response. Admitting that “land use regulations do add costs to housing”, it criticizes the Eicher study for focusing “solely on cost” and ignoring how land use regulations add to the quality of life. (Note 1). A recent Washington Policy Center report provides a detailed critique of the W-APA report. This article evaluates Seattle housing affordability trends using basic price and income data and the Median Multiple (median house price divided by median household income), a standard affordability measure that has been recommended by both the World Bank and the United Nations.
How Growth Management Raises House Prices: It has been established that overly prescriptive land use regulation (called growth management or smart growth) raises house prices. As the former governor of the Reserve Bank of New Zealand Donald Brash has pointed out the affordability of housing is overwhelmingly a function of just one thing, the extent to which governments place artificial restrictions on the supply of residential land.
However, the mere adoption of growth management or smart growth polices does not increase housing costs. Where, for example, an urban growth boundary (a favored strategy of growth management) is drawn far enough from the urban area, there may be little interference with developable land values. This was the case in Portland, for example, in its early growth management days. However, as land was developed and the urban growth boundary was not moved sufficiently outward in response, land became more scarce and land prices were driven up, leading to Portland’s severe housing unaffordability.
How Growth Management Drives Up House Prices: Land prices are driven up as market participants perceive scarcity. When government policies constrict the supply of land, developers purchase “land banks” to ensure that they have access to land inventory. Without growth management, developers and builders can purchase land when they need it, because governments have not placed artificial restrictions on its supply.
In the more prescriptive environment, property appraisals rise and sellers are able to obtain higher prices because development is prohibited on most land. In short, sellers face less competition and can command much higher prices.
Sometimes growth management proponents claim that their communities have sufficient land available for building. However, the interplay between land buyers and sellers creates a rigged game that leads to higher land prices. This is obvious in everywhere from Seattle and Portland to California and Florida. In these markets, there is not a sufficient supply of “affordable land” for building. A New Zealand government’s “2025 Taskforce” found the price of comparable land to be about 10 times as high if it is inside an urban growth boundary rather than outside (essentially across the road).
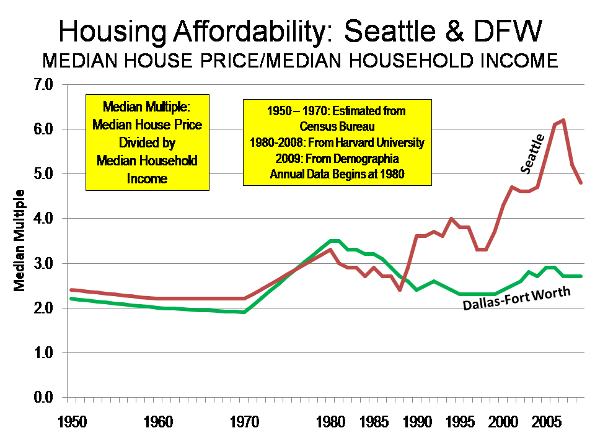
Seattle’s Lost Housing Affordability Decade: During the decade of the housing bubble (1997 to 2007), the median house price increased from $169,000 to $395,000 in Seattle. In 1997, Seattle’s housing affordability was rated “moderately affordable,” with a Median Multiple of 3.3 (median house price divided by median household income). By 2007, the Median Multiple had escalated to 6.2, indicating housing unaffordability worse than any major metropolitan area between World War II and 1997. (Figure 1). Of course, other markets, particularly in California, became even more unaffordable after 1997.
In Seattle and other more prescriptive markets, house prices exploded during the housing bubble. At the same time, many other markets experienced only modest house price increases. The easier money and profligate lending practices thus produced very different results. In more prescriptive markets, like Seattle, both underlying and speculative demand drove prices to unprecedented heights. In the more responsive markets, the generally higher underlying demand was accommodated by planning systems that permitted sufficient new housing to be built on affordable land and price escalation was far more modest (as were subsequent price losses).
New House Example: The role of Seattle’s growth management in driving up land and house prices is obvious. According to W-APA, approximately 62% of the cost of a new house in 1999-2000 was in construction costs. A new house in 1997 costing the same as a median house price would have involved approximately $105,000 in construction costs. Based upon subsequent house cost increases and the decline in house construction costs relative to the rest of the nation in Seattle, construction costs on the same house should have risen $40,000 from 1997 to 2007 (Note 2). At the same time, the median house price in Seattle increased $225,000. Less ss than 20% of the cost escalation could be attributed to construction cost inflation. Nearly $185,000 was due to other factors, principally higher land prices.
Comparing Seattle to Dallas-Fort Worth: Things were very different in more responsive markets, as is illustrated by Dallas-Fort Worth (Figure 2). Dallas-Fort Worth, now the nation’s fourth largest metropolitan area, trailing only New York, Los Angeles and Chicago has grown more than twice as fast as Seattle (21.2% from 2000 to 2008, compared to 9.6%). Dallas-Fort Worth’s underlying demand has been even greater relative to Seattle, as indicated by its net domestic migration. Dallas-Fort Worth has added more than 10 times as many domestic migrants (260,000 versus 23,000) and more than 5 times its 2000 population (5.0% v. 0.8%). Moreover, and perhaps surprisingly, the Dallas-Fort Worth urban area (along with Houston) is more compact (read “sprawls” less) than Seattle (Note 3). Finally, the share of sub-prime mortgages was higher in Dallas-Fort Worth than in Seattle.
Yet, despite this huge demand, housing affordability has remained below the historic Median Multiple norm of 3.0. In 2007, the Dallas-Fort Worth Median Multiple was 2.7. The median house price increased $32,000 from 1997 to 2007 and more than 70% of the change was due to construction costs.
In 1997, the Seattle median house price was $54,000 higher than in Dallas-Fort Worth. By 2007, the price of a median house in Seattle had escalated to nearly $250,000 more than its counterpart in Dallas-Fort Worth (Since 2007, house prices have dropped $90,000 in Seattle and $5,000 in Dallas-Fort Worth, illustrating the more intense price volatility of tightly regulated markets. Even so, Seattle housing affordability remains materially worse than before).
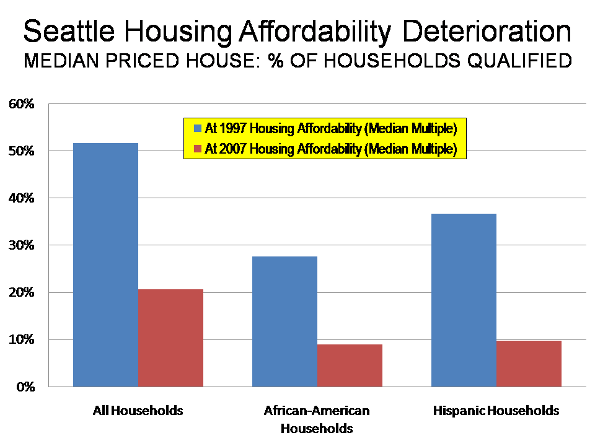
Driving Households out of the Home Ownership Market: If 1997 housing affordability (using the Median Multiple) had been retained, 50% of Seattle households would have been able to qualify for a mortgage on the median priced house. However, by 2007 only about 20% of Seattle households could have qualified for a mortgage on the median priced house in 2007 at present FHA underwriting standards (Note 4).
Impact on Minority Households: The highest price, however is being paid by Seattle’s minority households (Figure 2).
- The share of African-American households able to qualify for a mortgage on the median priced house declined nearly 70% compared to 1997 affordability (Median Multiple). At 1997 housing affordability, more than 25% of African American households would have been able to qualify for a mortgage on the median priced house in 2007. In reality, by 2007, less than 10% of African-American households could have qualified for a mortgage on the median priced house.
- The share of Hispanic households able to qualify for a mortgage on the median priced house declined more than 70% compared to 1997 affordability (Median Multiple). At 1997 housing affordability, more than 35% of Hispanic households would have been able to qualify for a mortgage on the median priced house in 2007; by 2007 than number had plunged to less than 10%.
The High Price of Growth Management in Seattle: The 10-year trend of house prices increases in the Seattle metropolitan area supports Eicher’s analysis. We readily admit to the charge of evaluating housing affordability “solely on price.” There is still the dubious W-APA claim that land regulation adds to the quality of life. But whose quality of life? As housing affordability declines, the quality of life may be raised for some, but only by keeping others down.
Notes:
(1) The W-APA report makes the common error of presuming that land use restraints were not a factor in the house price escalation of Phoenix and Las Vegas. In fact, the Brookings Institution ranks both metropolitan areas as toward the more restrictive end of the regulatory spectrum. These overly prescriptive regulatory environments are exacerbated by the fact that in both metropolitan areas much of the developable suburban land is owned by government, and is being auctioned, though at a rate less than demand. These factors combined to drive auction prices per acre up nearly 500% in Phoenix and nearly 400% in Las Vegas during the housing bubble. Despite their high building rates, these land restrictions denied sufficient affordable land for development to keep house prices from rising rapidly. Further, W-APA refers to Phoenix and Las Vegas as having “relatively unfettered sprawl,” yet both are more compact than Seattle. In 2000, the Las Vegas urban area (area of continuous urban development) was 62% more dense than Seattle and the Phoenix urban area was 28% more dense than Seattle (calculated from US Bureau of the Census data).
(2) There are no reliable sources for median new house prices at the metropolitan area level. Generally, however, US Bureau of the Census data indicates that in the West, the median priced new house costs have averaged 6% more than the median priced house in the 2000s. Construction cost escalation (national and Seattle) is calculated from R.S. Means Residential Square Foot Costs (1997 and 2007 editions).
(3) In 2000, the Seattle urban area had a density of 2,844 persons per square mile. Dallas-Fort Worth had a density of 2,946 and Houston had a density of 2,951. All three were relatively close to Portland (3,340), but well behind Los Angeles (7,069), which is the most dense major urban area in the nation.
(4) Estimated assuming a FHA “front end ratio” of 29%, (mortgage, property tax and homeowners insurance divided by gross annual income) and a 10% down payment. Calculated using 2007 American Community Survey income data for the Seattle metropolitan area.
Wendell Cox is a Visiting Professor, Conservatoire National des Arts et Metiers, Paris. He was born in Los Angeles and was appointed to three terms on the Los Angeles County Transportation Commission by Mayor Tom Bradley. He is the author of "War on the Dream: How Anti-Sprawl Policy Threatens the Quality of Life.”


Your House Now Comes with Microsoft Windows
I don't know. I think it's pretty obvious - or at least should be considered - that other factors might have started to drive up housing costs in 1985 besides growth management and supply restriction. It's debatable if that factor - "land supply" - even matters too much at all: housing prices in downtown Seattle would still increase even if they had sprawled like Dallas. Houses are not a supply-side commodity alone, like "widgets." Location, type, value and consumer access to credit or capital all play a much stronger role in the housing market than does the sheer quantity of supply. This is because a house in Issaquah does not create nearly the same utility for a consumer as a house on Capitol Hill.
People, thus, are willing to pay a larger share of their income for houses in that area. Similarly, they are willing to pay a higher share of their income if their income is much higher; and so too if it means they can have access to specialized, highly technical local job market that also provides non-income benefits, such as quality of life. If a software engineer is paid so much more that a high median multiple still leaves them with abundant discretionary income, they might be more than willing to do so if it provides them also higher quality of life, ie. cleaner air and water. I by no means agree that housing unaffordability is a good thing; but it is still the market at work nonetheless.
This appreciation of broader economic context leads me to wonder what else could have happened in 1985 that may help explain cost increases in Seattle. He's only using net migration as the primary indicator of demand, as if the only driver of housing price increases is population. It completely ignores that price increases could could come from any other factors; it doesn't even make lip service that those might exist. Jesus. I don't know anything that could be more absurd than this underlying assumption, it's almost difficult to even talk about.
It seems reasonable to me that housing prices might increase even without huge increases in population demand. Let's consider how. Say, perhaps, that the population of a city increases only modestly, but the amount of money that population is making increases dramatically (say, perhaps, an 8000-fold increase). In this case, this population would have more money to pay for houses, and so, could outbid existing properties more easily. This would clearly drive costs up without having five-fold increases in population.
Now, if Cox had constructed this argument better, he'd have confronted this counterargument by talking about Dallas's economic expansion over the same period contributing to profit growth in the energy industry and so on and so forth. However, such an attempt would still be questionable as that the oil industry is generally a slower-growth economy; computer technology was a more explosive growth economy, as it went from non-existent to commonplace in merely the course of his Seattle-vs.-Dallas graph.
In short, without paying any attention to, or even suggesting potential validity of, these nuances, his entire argument seems unconvincing (at best).
Constrained Land Supply
This point has to be explained over and over again.
The price of ANY commodity is kept within the normal bounds of pricing created by the interaction of supply and demand; PROVIDING that there are no restrictions to further provisions of that commodity. Any time a government has restricted supplies, even to quite generous quantities, the opportunity is presented for speculators to "corner" the market.
The onus is on the regulators to anticipate this and prevent it. It is scandalous that they turn around and blame speculators for the consequences that THEY prepared the ground for. It is not even fair to blame developers; they wish to stay in business and must engage in a bidding war and hold "land banks" (that costs them in finance, often for years) merely to stay in business. Developers are victims as much as anyone else.
Some point has to be reached in a speculative bubble, where prices simply cannot be sustained any longer. This is especially the case with property, the total sums of money involved are a substantial proportion of any economy. Often the whole economy is being deprived of productive investment capital, and households servicing bigger and bigger mortgages are deprived more and more of discretionary income to spend on other things. Slowly, a whole economy can be ground to a halt.
Then when the crash comes, yes, the land supply constraints DO prevent the prices from crashing back to normal "affordable" levels. But when the median multiplier went to 7, 8, and 9 and crashes back to, say, 4.5, (affordable is 3.0), hundreds of billions of dollars are wiped out of mortgage financing markets.
Las Vegas' Constraints
In Randal O'Toole, "Paying the Planning Tax":
http://www.cato.org/pub_display.php?pub_id=8833
The following comments:
"......With few exceptions, the states that saw the biggest bubbles were ones that had passed growth-management planning laws. And with one exception, every state that has passed such a law also saw a housing bubble.
The exceptions were New York and Nevada (where prices grew without a growth-management law) and Tennessee (where prices didn't grow, in spite of a 1998 growth-management act). New York prices only grew in the New York City area, which is surrounded by states and suburbs that have growth-management laws and plans. Nevada prices grew because Las Vegas has literally run out of private land; it is surrounded by federal land and federal land sales have not kept up with growth. Tennessee's prices haven't grown because regional growth-management plans included lots of vacant land in their urban-growth boundaries, so there is, as yet, no shortage......"
Randal O'Toole
has already shown to be less-than-credible. He fronted an astro-turfing campaign organization in our area, to derail (heh) light rail development. Unfortunately, he was discovered, and since has left the metro area. He's shown to have been funded by industry that is threatened by changes that were coming to the area.
Vegas, supply, and demand
I'd like to hear Mr. Cox explain how constrained supply led to Las Vegas' 56% drop in home prices from the peak of the bubble. If it was a matter of restricted supply, prices would have stayed high. The fact that they rose then crashed can only be explained by speculative demand. High-regulation cities like Boston, Seattle, New York, and Portland all had lower than average price declines as measured by the Case-Shiller index. Yes, free-wheeling Dallas had only a 5% price decline, but all this says is that metro land use regime doesn't have a clear correlation with price declines one way or the other. It hardly supports Mr. Cox's ideological argument.
That's a whole lotta numbers
but very little real information.
Seattle's land use policy have a lot to do with it's unique geography. Hemmed in by lakes, the sound, and steep hills, does more to affect home prices inside of the seattle metro area than land use regulation does. For the most part, Sprawl already exists in that area, in the form of Redmond, Kent, etc. Commute times from those areas, to centers of employment have already become difficult to contend with.
I also suspect that you feign concern for the underprivileged in your article. Otherwise, the issue of wage discrimination might have been mentioned.
Your corporate libertarian viewpoint has too much evidence against it. How about paying a visit to Ellensburg, just a "quick jaunt" down I-90? During times of relatively inexpensive fuel, Ellensburg was a refuge for people that wanted "country living", and non-existent planning. Now it's a heavy foreclosure zone, as people return to urban centers on the west side of the mountains.
You're article also misses the point, in those figures. People that live there, like to live there, and that increases home prices. Remove public services, land use regulation, and prices will come down. Primarily because it will become less desirable. Major employers would move out, as the most qualified employees would leave as well.
The world will be altering fast
The world will be altering fast. people are also being changed.day by day we are becoming more dependant on degital system.you make me think of this really.You have a pleasant way of sharing your post.
Political problem
Of course it will be really difficult to convince current homeowners to roll back the regulations. After all, why would they want to lower their own house prices?
I call it the taxi medallion effect: taxi medallions have value only because the government limits their supply. But the loudest supporters of the system are the current medallion owners - their $200K investments would be wiped out if the system were changed.