
For a hundred years, Americans have been moving south and west. This, with an occasional hiccup, has continued, according to the 2010 Census.
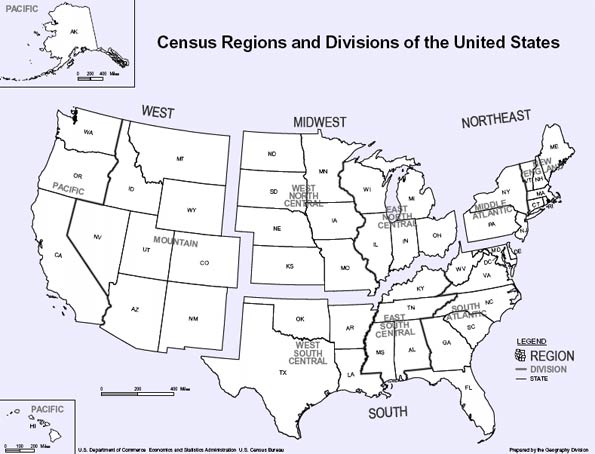
During the 2000s, 84 percent of the nation's population growth was in the states of the South and West (see Census region and division map below), while growth has been far slower in the Northeast and Midwest. This follows a pattern now four decades old, in which more than 75 percent of the nation's population growth has been in the South and West. Indeed in every census period since the 1920s the South and West attracted a majority of the population growth.
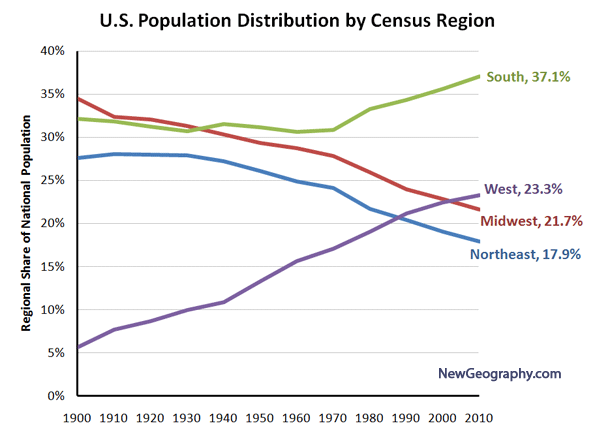
In the first census after World War II, in 1950, the East and the Midwest accounted for 58 percent of the nation's population, with the South and West making up 42 percent. Since that time, the East and the Midwest have added less than 40 million people, while the South and West added nearly 120 million. Today, the ratios are nearly reversed, with 60 percent of the population living in the South and West and only 40 percent in the East and Midwest.
The dominance of the South and West was overwhelming. The 24 fastest growing states were all in the South and West. The fastest growing state outside the West and South, surprisingly, was South Dakota, which added a second decade of unprecedented growth, after having gained almost no population between 1930 and 1990.
Fastest and Slowest Growing States: The fastest growing states were the adjacent Mountain states of Nevada (35.1%), Arizona (24.6%), Utah (23.8%) and Idaho (21.1%). The only large state among the top five growing states was Texas, at 20.1%. These all greatly exceeded the national average growth rate of 9.7%
Michigan was the only state to lose population (-0.6%) and became the first state in American history to ever exceed 10 million population (earlier in the decade) and then to fall back below that figure. Rhode Island grew only 0.4%. Louisiana grew only 1.4%, which in itself is an accomplishment given the 5 % loss that occurred between 2005 and 2006 after Hurricanes Katrina and Rita. Ohio ranked fourth lowest, gaining only 1.6%. New York continued its laggard performance, gaining only 2.1%. Since the late 1960s, New York (long the largest state) has added little more than one million people, while California added 19 million and has nearly doubled New York's population.
California: But all was not well in California. In every 10 year period after the 1920s, California added more people than any other state, until now. Between 2000 and 2010, Texas added 4.1 million people, nearly one million more than California.
In no decade following the Depression (1930s) has California added so few new residents as in the 2000s. In the 1940s, California's population rose by 3.7 million, starting from a 1940 base of 6.9 million. During the 2000s, the population increase was 3.4 million, on a 2000 base of 33.8 million.
California still grew little faster than the national rate (10.0 percent compared to 9.7 percent). Yet this remains the lowest population growth rate for the state since its first Census, in 1850.
Regional Analysis: The data, both state and regional, that is the basis of the regional analysis below is shown in Tables 1 and 2.
The South: The South has had the largest share of the nation's population since the 1940 census and it is now home to nearly 115 million people. The growth has been substantial, with 73 million new residents from 1950 to 2010, expanding 143%, more than twice the national growth rate of 104%. Overall, the South led national growth in the last decade, with a 14.3% rate and adding 14.2 million people. After Texas, the fastest growing states were North Carolina (18.5%), Georgia (18.3%) and Florida (17.6%), which had seen its growth reduced during the housing collapse. South Carolina (15.3%) also grew strongly. Outside of Louisiana, the slowest growth was in West Virginia (2.5%) and Mississippi (4.3%).
The West: Since 1950, the West has added 58 million people, growing 256%. The West grew the second fastest among the regions, at 13.8% and added 8.7 million residents. As noted above, four of the five fastest growing states were in the Mountain West. In addition, Colorado grew 16.9%.
The Midwest: Until the emergence of the South in 1940, the Midwest had been the nation's largest region. Growth has been very slow. Since 1950, the Midwest has added 22.5 million people, but grown only 50 percent, or one-half the national rate of 104 percent. The Midwest had no states that grew above the national rate and had two of the states with the least growth (Michigan and Ohio). Perhaps signaling the rise of the upper Midwest, both North and South Dakota are growing faster than many Eastern or Midwestern states. After decades of population loss, South Dakota experienced unusual growth for the second decade in a row, while North Dakota, grew enough this decade to recover from decades of population loss dating to 1930.
The Northeast: The nation's former commercial heartland, the Northeast, has for its third census placed as the nation's least populated region. A prediction in 1950 that the region housing New York, Philadelphia and Boston would fall so much in relative terms would have been considered absurd. Yet, from 1950 to 2010, the region added 16 million people, for the lowest regional growth rate (40%). The region added less than 2,000,000 population between 2000 and 2010, for a growth rate of 3.2%. The fastest growing state was New Hampshire, at 6.5%, reflecting the growth of its Boston suburbs and exurbs. All other states had growth rates less than one-half of the national rate.
"Kudos" to the Bureau of the Census: Finally, congratulations are due the Bureau of the Census. In 2000, the Bureau was embarrassed by its under-estimation of the population during the previous decade. At the 1990 to 1999 estimation rate, the 2000 population would have been nearly 7,000,000 below the number of people actually counted in the census. The improvement during the decade of the 2000s was substantial. At the 2000 to 2009 estimate rate, the nation would have had 500,000 more people than were counted in 2010. Missing by less than 0.2 percent is pretty impressive.
| Table 1 | |||||||
| Regional Population: 1950-2010 (Census) | |||||||
| Division/REGION | 1950 | 1960 | 1970 | 1980 | 1990 | 2000 | 2010 |
| New England | 9,314,453 | 10,509,367 | 11,841,663 | 12,348,493 | 13,206,943 | 13,922,517 | 14,444,865 |
| Middle Atlantic | 30,163,533 | 34,168,452 | 37,199,040 | 36,786,790 | 37,602,286 | 39,671,861 | 40,872,375 |
| NORTHEAST | 39,477,986 | 44,677,819 | 49,040,703 | 49,135,283 | 50,809,229 | 53,594,378 | 55,317,240 |
| East North Central | 30,399,368 | 36,225,024 | 40,252,476 | 41,682,217 | 42,008,942 | 45,155,037 | 46,421,564 |
| West North Central | 14,061,394 | 15,394,115 | 16,319,187 | 17,183,453 | 17,659,690 | 19,237,739 | 20,505,437 |
| MIDWEST | 44,460,762 | 51,619,139 | 56,571,663 | 58,865,670 | 59,668,632 | 64,392,776 | 66,927,001 |
| NORTHEAST & MIDWEST | 83,938,748 | 96,296,958 | 105,612,366 | 108,000,953 | 110,477,861 | 117,987,154 | 122,244,241 |
| Southeast | 21,182,335 | 25,971,732 | 30,671,337 | 36,959,123 | 43,566,853 | 51,769,160 | 59,777,037 |
| East South Central | 11,477,181 | 12,050,126 | 12,803,470 | 14,666,423 | 15,176,284 | 17,022,810 | 18,432,505 |
| West South Central | 14,537,572 | 16,951,255 | 19,320,560 | 23,746,816 | 26,702,793 | 31,444,850 | 36,346,202 |
| SOUTH | 47,197,088 | 54,973,113 | 62,795,367 | 75,372,362 | 85,445,930 | 100,236,820 | 114,555,744 |
| Mountain | 5,074,998 | 6,855,060 | 8,281,562 | 11,372,785 | 13,658,776 | 18,172,295 | 22,065,451 |
| Pacific | 15,114,964 | 21,198,044 | 26,522,631 | 31,799,705 | 39,127,306 | 45,025,637 | 49,880,102 |
| WEST | 20,189,962 | 28,053,104 | 34,804,193 | 43,172,490 | 52,786,082 | 63,197,932 | 71,945,553 |
| SOUTH & WEST | 67,387,050 | 83,026,217 | 97,599,560 | 118,544,852 | 138,232,012 | 163,434,752 | 186,501,297 |
| UNITED STATES | 151,325,798 | 179,323,175 | 203,211,926 | 226,545,805 | 248,709,873 | 281,421,906 | 308,745,538 |
| Table 2 | |||||||
| States and DC: Population 1950-2010 (Census) | |||||||
| State | 1950 | 1960 | 1970 | 1980 | 1990 | 2000 | 2010 |
| Alabama | 3,061,743 | 3,266,740 | 3,444,165 | 3,893,888 | 4,040,587 | 4,447,100 | 4,779,736 |
| Alaska | 128,643 | 226,167 | 300,382 | 401,851 | 550,043 | 626,932 | 710,231 |
| Arizona | 749,587 | 1,302,161 | 1,770,900 | 2,718,215 | 3,665,228 | 5,130,632 | 6,392,017 |
| Arkansas | 1,909,511 | 1,786,272 | 1,923,295 | 2,286,435 | 2,350,725 | 2,673,400 | 2,915,918 |
| California | 10,586,223 | 15,717,204 | 19,953,134 | 23,667,902 | 29,760,021 | 33,871,648 | 37,253,956 |
| Colorado | 1,325,089 | 1,753,947 | 2,207,259 | 2,889,964 | 3,294,394 | 4,301,261 | 5,029,196 |
| Connecticut | 2,007,280 | 2,535,234 | 3,031,709 | 3,107,576 | 3,287,116 | 3,405,565 | 3,574,097 |
| Delaware | 318,085 | 446,292 | 548,104 | 594,338 | 666,168 | 783,600 | 897,934 |
| District of Columbia | 802,178 | 763,956 | 756,510 | 638,333 | 606,900 | 572,059 | 601,723 |
| Florida | 2,771,305 | 4,951,560 | 6,789,443 | 9,746,324 | 12,937,926 | 15,982,378 | 18,801,310 |
| Georgia | 3,444,578 | 3,943,116 | 4,589,575 | 5,463,105 | 6,478,216 | 8,186,453 | 9,687,653 |
| Hawaii | 499,794 | 632,772 | 768,561 | 964,691 | 1,108,229 | 1,211,537 | 1,360,301 |
| Idaho | 588,637 | 667,191 | 712,567 | 943,935 | 1,006,749 | 1,293,953 | 1,567,582 |
| Illinois | 8,712,176 | 10,081,158 | 11,113,976 | 11,426,518 | 11,430,602 | 12,419,293 | 12,830,632 |
| Indiana | 3,934,224 | 4,662,498 | 5,193,669 | 5,490,224 | 5,544,159 | 6,080,485 | 6,483,802 |
| Iowa | 2,621,073 | 2,757,537 | 2,824,376 | 2,913,808 | 2,776,755 | 2,926,324 | 3,046,355 |
| Kansas | 1,905,299 | 2,178,611 | 2,246,578 | 2,363,679 | 2,477,574 | 2,688,418 | 2,853,118 |
| Kentucky | 2,944,806 | 3,038,156 | 3,218,706 | 3,660,777 | 3,685,296 | 4,041,769 | 4,339,367 |
| Louisiana | 2,683,516 | 3,257,022 | 3,641,306 | 4,205,900 | 4,219,973 | 4,468,976 | 4,533,372 |
| Maine | 913,774 | 969,265 | 992,048 | 1,124,660 | 1,227,928 | 1,274,923 | 1,328,361 |
| Maryland | 2,343,001 | 3,100,689 | 3,922,399 | 4,216,975 | 4,781,468 | 5,296,486 | 5,773,552 |
| Massachusetts | 4,690,514 | 5,148,578 | 5,689,170 | 5,737,037 | 6,016,425 | 6,349,097 | 6,547,629 |
| Michigan | 6,371,766 | 7,823,194 | 8,875,083 | 9,262,078 | 9,295,297 | 9,938,444 | 9,883,640 |
| Minnesota | 2,982,483 | 3,413,864 | 3,804,971 | 4,075,970 | 4,375,099 | 4,919,479 | 5,303,925 |
| Mississippi | 2,178,914 | 2,178,141 | 2,216,912 | 2,520,638 | 2,573,216 | 2,844,658 | 2,967,297 |
| Missouri | 3,954,653 | 4,319,813 | 4,676,501 | 4,916,686 | 5,117,073 | 5,595,211 | 5,988,927 |
| Montana | 591,024 | 674,767 | 694,409 | 786,690 | 799,065 | 902,195 | 989,415 |
| Nebraska | 1,325,510 | 1,411,330 | 1,483,493 | 1,569,825 | 1,578,385 | 1,711,263 | 1,826,341 |
| Nevada | 160,083 | 285,278 | 488,738 | 800,493 | 1,201,833 | 1,998,257 | 2,700,551 |
| New Hampshire | 533,242 | 606,921 | 737,681 | 920,610 | 1,109,252 | 1,235,786 | 1,316,470 |
| New Jersey | 4,835,329 | 6,066,782 | 7,168,164 | 7,364,823 | 7,730,188 | 8,414,350 | 8,791,894 |
| New Mexico | 681,187 | 951,023 | 1,016,000 | 1,302,894 | 1,515,069 | 1,819,046 | 2,059,179 |
| New York | 14,830,192 | 16,782,304 | 18,236,967 | 17,558,072 | 17,990,455 | 18,976,457 | 19,378,102 |
| North Carolina | 4,061,929 | 4,556,155 | 5,082,059 | 5,881,766 | 6,628,637 | 8,049,313 | 9,535,483 |
| North Dakota | 619,636 | 632,446 | 617,761 | 652,717 | 638,800 | 642,200 | 672,591 |
| Ohio | 7,946,627 | 9,706,397 | 10,652,017 | 10,797,630 | 10,847,115 | 11,353,140 | 11,536,504 |
| Oklahoma | 2,233,351 | 2,328,284 | 2,559,229 | 3,025,290 | 3,145,585 | 3,450,654 | 3,751,351 |
| Oregon | 1,521,341 | 1,768,687 | 2,091,385 | 2,633,105 | 2,842,321 | 3,421,399 | 3,831,074 |
| Pennsylvania | 10,498,012 | 11,319,366 | 11,793,909 | 11,863,895 | 11,881,643 | 12,281,054 | 12,702,379 |
| Rhode Island | 791,896 | 859,488 | 946,725 | 947,154 | 1,003,464 | 1,048,319 | 1,052,567 |
| South Carolina | 2,117,027 | 2,382,594 | 2,590,516 | 3,121,820 | 3,486,703 | 4,012,012 | 4,625,364 |
| South Dakota | 652,740 | 680,514 | 665,507 | 690,768 | 696,004 | 754,844 | 814,180 |
| Tennessee | 3,291,718 | 3,567,089 | 3,923,687 | 4,591,120 | 4,877,185 | 5,689,283 | 6,346,105 |
| Texas | 7,711,194 | 9,579,677 | 11,196,730 | 14,229,191 | 16,986,510 | 20,851,820 | 25,145,561 |
| Utah | 688,862 | 890,627 | 1,059,273 | 1,461,037 | 1,722,850 | 2,233,169 | 2,763,885 |
| Vermont | 377,747 | 389,881 | 444,330 | 511,456 | 562,758 | 608,827 | 625,741 |
| Virginia | 3,318,680 | 3,966,949 | 4,648,494 | 5,346,818 | 6,187,358 | 7,078,515 | 8,001,024 |
| Washington | 2,378,963 | 2,853,214 | 3,409,169 | 4,132,156 | 4,866,692 | 5,894,121 | 6,724,540 |
| West Virginia | 2,005,552 | 1,860,421 | 1,744,237 | 1,949,644 | 1,793,477 | 1,808,344 | 1,852,994 |
| Wisconsin | 3,434,575 | 3,951,777 | 4,417,731 | 4,705,767 | 4,891,769 | 5,363,675 | 5,686,986 |
| Wyoming | 290,529 | 330,066 | 332,416 | 469,557 | 453,588 | 493,782 | 563,626 |
| United States | 151,325,798 | 179,323,175 | 203,211,926 | 226,545,805 | 248,709,873 | 281,421,906 | 308,745,538 |
Wendell Cox is a Visiting Professor, Conservatoire National des Arts et Metiers, Paris and the author of “War on the Dream: How Anti-Sprawl Policy Threatens the Quality of Life”
Photo by Travelin' Librarian - Michael Sauers


For a hundred years,
For a hundred years, Americans have been moving south and west. This, with an occasional hiccup, has continued, according to the 2010 Census.
During the 2000s, 84 percent of the nation's population anime online growth was in the states of the South and West (see Census region and division map below), while growth has been far slower in the Northeast and Midwest. This follows a pattern now four decades old, in which more than 75 percent manga online of the nation's population growth has been in the South and West. Indeed
California's limited growth
Recall that California is among the more urban of states (there is a lot of empty land in the state). If you look at the Urban areas due to geographic features such as mountains and hills as well as bodies of water the newest development make the two major urban areas to large to make sense (Santa Barbara to Palm Springs for example). Both areas have started to grow outside the natural boundaries of the metro areas, placing choke points in the traffic flow. Now if we for example (thinking in the grand 1950s style of engineering) were to fill in San Francisco Bay south of the Bay Bridge, by cuttting the hills down, and level the mountains around LA we could solve the problem but....
Most U.S. states have a lot of empty land
I live in the small (compared to California) state of Maryland.
We still have a lot of open, undeveloped land in our state, even though we have been trying to develop it since the first settlers from Europe arrived in 1634.
Even the (even smaller) state to our east, Delaware, has a remarkable amount of mostly tabletop flat, undeveloped land.