
While everyone seems to know someone who has been divorced, rates can vary widely by state. Why? Do high divorce states have anything in common? We took a look at some visualizations of state divorce rates against a few other demographic characteristics.
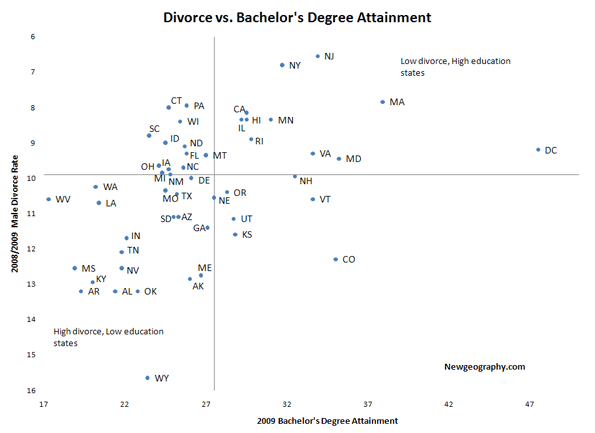
The latest Census data offers up some observations of how divorce varies regionally. The first graph shows 2008/2009 divorce rate against 2009 bachelor’s degree educational attainment. We average two years of Census divorce rate data to help even out the variance caused by small sample sizes.
The chart produces interesting find: states with a high level of bachelor degree attainment (27.5% of the population or higher) also have relatively low divorce rates (lower than 9.9%). States such as California, Hawaii, Minnesota, Illinois, and much of the Northeast fit this profile. Meanwhile, Southeastern and mostly rural states fall in the territory dominated by high divorce rates and low bachelor’s degree attainment.
This relationship is an alluring one that has been touched on previously. A New York Times article seems to suggest that education does have an impact on divorce rates, especially in rural areas. As married partners become more educated, perhaps this leads to a stronger sense of individualism, or the education of one partner may make them more employable and geographically mobile. The article cites Sioux County, IA as a premier example of this. Heralding from the area myself, I can attest to the strong religious ideologies in that region.
Orange City in Sioux County is an especially strong example, where a deeply-rooted religious presence mixed with a strong conservative disposition helps to feed a socially conservative society. For example, during the city’s regionally renowned Tulip Festival that occurs every year in mid-May, defacing a precious tulip results in a police citation. On top of this, many storefronts are closed on Sundays, grass must be cut a certain length on a certain day with no exceptions, and taking an absence from the church can lead to adverse social consequences within the community.
Having such a tight grasp on values leaves little room for anything other than heritage by the city’s residents, especially when these traditions are held in high merit amongst the city dwellers. A strong commitment to a pre-ordained structure seems to have kept women in a certain place -- one with less agency and more conformity. Not that this is against any person’s will, quite the contrary: the social structure is geared towards these values and it has stuck since inception.
Divorce may not work the same in much more populated areas. Regions such as California and the Northeast have low divorce rates while their populations are some of the largest and most concentrated in the nation. Add to this equation the states that contain within them top tier schools (the Ivy League, Stanford, and University of Chicago come to mind) are also more likely to have low divorce rates. Perhaps the emphasis on education in these mostly urban areas has allowed for a more stable social structure. One in which secularism prevails and the choice of marriage between two people suddenly becomes a pragmatic decision rather than one made out of need or what “should be”.
The chart pitting divorce against average income also reveals a disparity between regions—the higher the household makes annually, the less likely the couple inhabiting it is to be divorced. States such as New Jersey, Hawaii, Connecticut and Massachusetts can all be located here. Meanwhile, households in states with lower incomes (such as states in the South) seem to possess higher rates of divorce. The trend seems to put the Northeast in opposition to the Southeast and the Rust Belt.
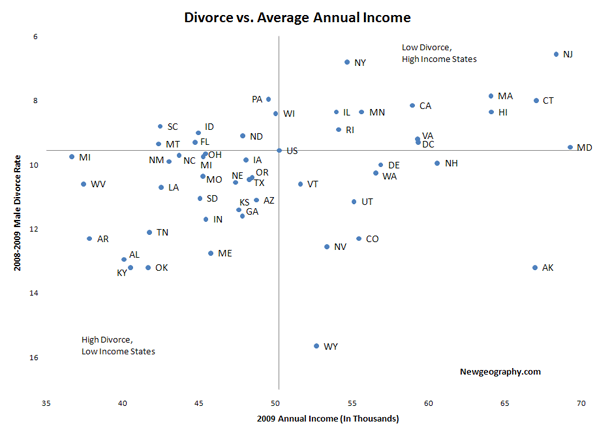
Many of the states settled first with more well-established economies (and perhaps older money) seem to have a lower amount of divorce. Meanwhile, hard-struck regions (Michigan, the Southeast) have below-average rates in general. The more money that households accumulate in these regions, the seemingly lower the rates are. Combine this with less volatile housing markets and economies established in technology and education and much of the Northeast and Midwest seem to be more stable. Of course, education and income levels are highly interrelated themselves.
The last graph displayed here gives the relationship between divorce rates and the percentage of married couples in which both partners work. As in the previous graphs, Northeastern states dominate the first quadrant as well as some Midwestern states. Meanwhile, the Sun Belt and Southeastern states seem to lag on both measures, much like in the other charts. Interestingly, in general the northern tier of the U.S. – especially the northeast and northern plains – seems to have a much higher rate of dual income couples than the south.
The data here may suggest that hard-working couples stick together naturally, or at least persevere more effectively. Perhaps the work ethic amongst couples in these states translates to sound marriage values as well, however correlation to divorce rate seems weaker here than with education and income.
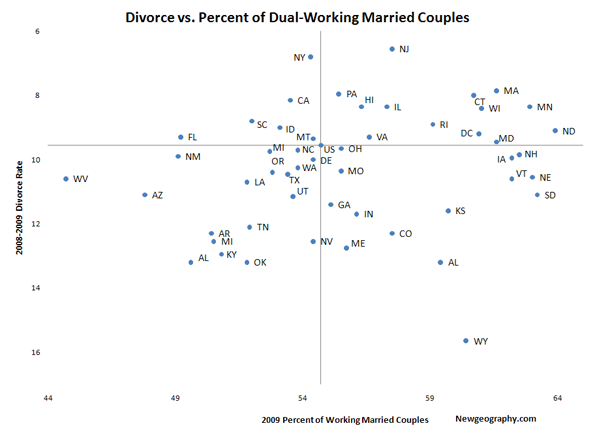
An outlier for divorce seems to be Wyoming whose high divorce rate (a 2008-2009 average of 16%) places it outside of the bunch in many of the graphs. This may be because of the state’s “quickie” divorces. An article by Wyoming News discusses the reality of Wyoming’s label as “Splitsville” where many couples unhappy with their marriages travel to call it quits. The state lacks laws that force a couple to separate for some time prior to the official divorce, making the state more appealing for those who don’t wish to remain together. With all of the proper paper work in line, a couple could easily end it in Wyoming. Where Las Vegas is the home for a fast espousal, Cheyenne may be the new destination for a speedy separation.
Jacob Langenfeld is an undergraduate at the University of Iowa studying economics and entrepreneurship. He aspires to pursue graduate work in one of his many interests, including economics, public policy, and urban issues.
Photo by DrJohnBullas


