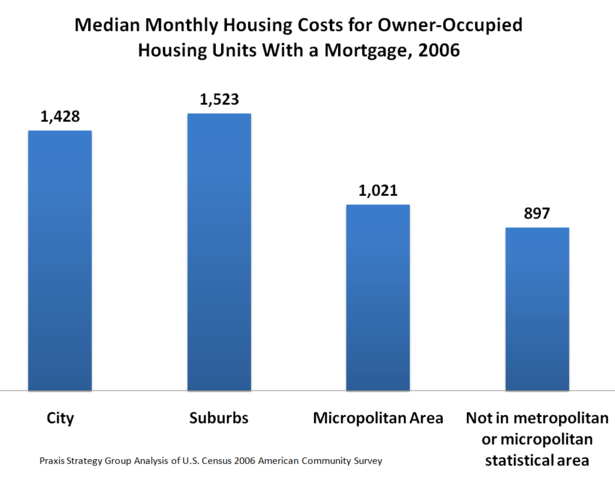
Median Monthly Housing Costs for Owner-Occupied Housing Units With a Mortgage, 2006

Image: 
3geoHousingCost.png
Source: 
Praxis Strategy Group Analysis of U.S. Census 2006 American Community Survey

Comment viewing options

Select your preferred way to display the comments and click "Save settings" to activate your changes.

I live in the suburbs and my

I live in the suburbs and my aunt and cousins are into real estate they all saw this coming with the amount of people getting mortgages that couldn't afford them. Now banks and companies are getting bailed out and people lose everything. It's really not right. Looking at a mortgage calculator can tell you what you can afford, to bad more people don't use them and take their advice.

If there is something you

If there is something you would like to know about housing in America - no matter how important, inconsequential, or obscure - the American Housing Survey (AHS) probably covers it.

How many total housing units exist in the U.S.? 128,203,000. How many of these consist of one room and how many of 10 or more? 689,000 and 3,024,000 respectively. And how many units have holes in the floor (612,000) or exposed wiring (344,000)?

Obviously a treasure trove of information if the reader can get past asking himself why on earth a government researcher would inquire whether a home’s toilet was inoperable for six hours or more in the last three months.

The AHS is a joint project of the U.S. Department of Housing and Urban Development and the U.S. Census Bureau. The survey was conducted annually from 1973 until 1981 and every other year since then. The 2007 survey which was just released contains data collected in 52,850 interviews* and contains information on apartments, single-family homes, manufactured and mobile homes and vacant housing units. It covers information on the age, race, and sex of householders, income, housing and neighborhood quality; housing costs; housing equipment, heating fuels, and size and composition of units. It also presents data on mortgages, rent control and rent subsidies and transitory patterns of households.

(*The discrepancy between the number of surveys conducted and the much larger numbers given in the report is due to weighting. Survey data was weighted consistent with U.S. Census protocols.)

Because of the delay between data collection and release and given the volatile nature of the current housing market, much of the information is already obsolete except to use in comparison with past and future years. For example, the number of owner occupied units and the number of vacant units have both undergone significant changes in the last nine months due to foreclosures and depressed home sales. But kidding and this writer’s snarkiness aside, the massive report is a resource for data in a number of areas that are of interest to researchers, planners, and state and local officials.

All of the data is cross tabulated a number of different ways. It is all broken down by type of location - within a metropolitan statistical areas, urban area or rural - and is given broken out by race of household head (Black and Hispanic.) Much of the information is also identified by occupancy status, and some by condition of the home.

Among the information that I found interesting:

* Housing Characteristics

* - The median size of a housing unit is 1,769 square feet with owner occupied units running about 30 percent larger than rental units.

* - 4,285,000 homes exceed 4,000 square feet and 95 percent of these are owner occupied.

* - 1,753,000 housing units do not have a complete bathroom while 61 percent of units have at least 3 bedrooms.

* - The median lot size occupied by single family houses is .35 acre.

* - Of the approximately 128,000,000 reported housing units, 9,293,000 were in condo or coop developments and 8,705,000 were mobile or manufactured homes.

* Income Characteristics of Occupants

* - There is significant difference between the income of households in owner-occupied dwellings and among renters. The median income of home owners in the 75,647,000 households responding is $59,866 while renters (35,035,000 surveyed) have an income of $28,921.

* - There is also a strong income difference when homeowners are Black or Hispanic but less variation among renters. In owner-occupied Black homes the median is $46,445 and in Hispanic homes it is $52,830. Black renters have a median income of $24,217 and Hispanics $28,561.

* - There is a striking income difference in households headed by an elderly person. In owner occupied homes the median income is $29,467; in rental units it is $15,130.

- Among renters approximately 25 percent live in public housing or receive some type of rental subsidy.

* Mortgages and Housing Costs

* - 24,885,000 or approximately 1/3 of owner-occupied homes are owned free and clear of mortgages.

* - 32,963,000 homes have a single mortgage while 11,741,000 carry two and there are three or more mortgages on 847,000 owner occupied homes.

* - Homeowners have a median monthly principal and interest payment on their mortgages of $852 and monthly property taxes are $144. The median tax rate is $9 per $1,000 of property value.

* - Among all homeowners the median percentage of monthly income paid for housing is 23 percent. However, owner-occupants direct 20 percent of their income to housing costs while renters pay 30 percent of their income on rent, utilities, and other housing related costs.

- Home maintenance is does not appear to be a major priority. Of the 75,647,000 owners surveyed, 29,335,000 report that they spend less than $25 per month on this category of expense. The median spent on home maintenance is $30 per month.

____________________
Submited by : Libros Gratis