
In defiance of the conventional wisdom in the national media and among most planning professionals, Americans continue not only to prefer, but to move into single family detached houses. Data from the 2010 American Community Survey indicates that such housing attracted 79.2% of the new households in the 51 major metropolitan areas (over 1,000,000 population) over the past decade.
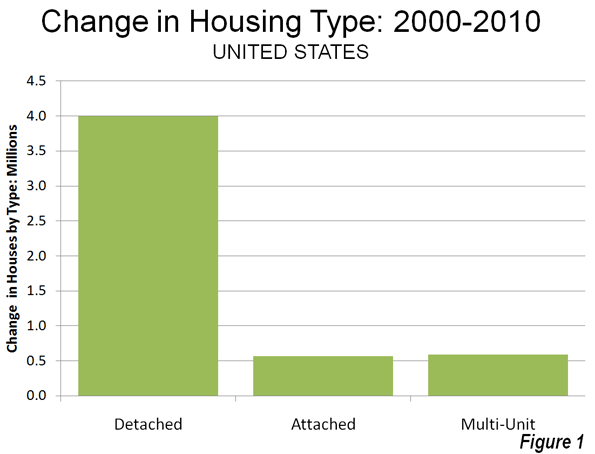
In contrast households in multi-unit buildings (apartments and condominiums) represented 11.8% of the new housing, while two-unit attached housing represented 11.3% of the increase. There was a 2.3% decline in the "other" category of new housing, which includes mobile homes and boats. A total of 4 million net new occupied detached houses were added in the largest metropolitan areas, while there were 590,000 additional apartments and condominiums and 570,000 attached houses (Figure 1).
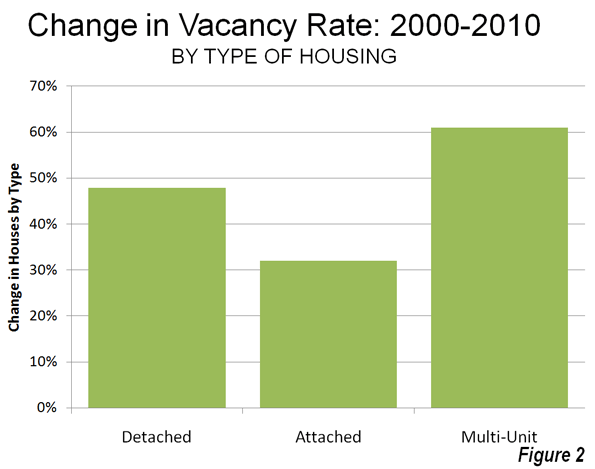
Detached Vacancy Rate Rises Less than Multi-Unit: Another conventional assumption is that single family homes have been disproportionately abandoned by their occupants, particularly since the collapse of the housing bubble. This is also not true. In 2010 detached housing enjoyed a 92.4% occupancy rate in 2010 which is higher than the 89.4% occupancy rate in attached housing and 84.2% occupancy rate in multi-unit buildings. Because a more of the multi-unit housing is rental, it is to be expected that the vacancies would be the highest in this category. However, at the national level, overall vacancy rates rose the most in multi-unit housing, with an increase of 61%, from 10.7% in 2000 to 17.1% in 2010. The vacancy rate in detached housing rose at a slower rate, from 7.3% in 2000 to 10.7% in 2010, an increase of 48%. Attached housing – such as townshouses – have the slowest rise in vacancy rate, from 8.4% in 2000 to 11.0% in 2010, an increase of 32% (Figure 2).
Detached and Attached Up in Most Markets, Apartments and Condominiums Down in Most: The move to detached housing was pervasive at the major metropolitan area level. Among the 51 largest metropolitan areas, the share of detached housing rose in 44 and declined in seven. The share of attached housing rose in 32 of the metropolitan areas, while declining in 19. Multi-unit housing experienced an increase in its market share in only three markets, while declining in 48.
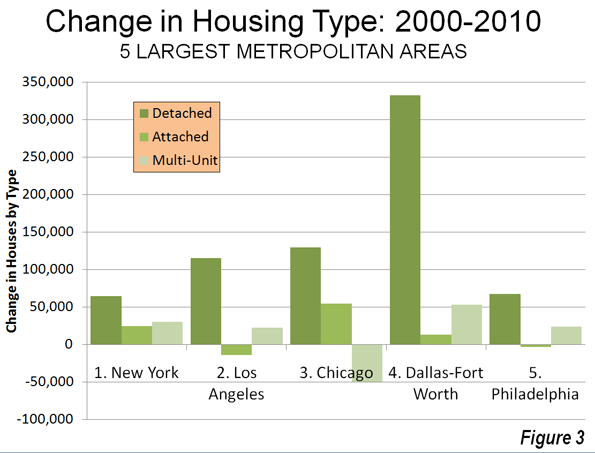
Largest Metropolitan Areas: Detached housing also increased more than attached housing and multi-unit housing in each of the nation's five largest metropolitan areas.
- In the largest metropolitan area, New York, 51.9% of the new housing was detached. This is considerably more than the 36.9% detached market share in 2000. Multi-unit housing accounted for 24.1% of the increase in the market. This is a far smaller share than the 55.7% that multi-unit housing represented in 2000. Attached housing was 19.9% of the increase, nearly 3 times its 2000 share of 6.7%. This movement of New Yorkers to less dense housing forms is particularly significant, in view of the fact that New York has historically had the lowest share of lower density housing (detached and attached) and the highest share of multi-unit houses.
- In the second largest metropolitan area, Los Angeles, 96.0% of the new housing was detached. This is nearly double the 49.7% that detached housing represented of the market in 2000. The balance of the new housing was split between a share of 18.6% for multi-unit housing and a loss of 11.8% in the attached housing. The share of new units represented by multi-unit houses was less one-half than its percentage of the market in 2000 (39.0%).
- In the third largest metropolitan area, Chicago, 95.9% of the new housing was detached, well above the 52.5% share in 2000. There was a huge loss in apartment and condominium share, at 31% of the market, while attached housing captured 40.4% of the market.
- In the fourth largest metropolitan area, Dallas Fort Worth, 84.3% of the new housing was detached, well above the 62.0% share in 2000. Multi-unit housing accounted for 13.5% of the increase, approximately one-half the 2000 market share. Attached housing represented 3.2% of the increase.
- In the fifth largest metropolitan area, Philadelphia, 77.6% of new housing was detached, well above the 45.3% market share for detached housing in 2000. Apartments and condominiums accounted for 27.7% of the increase between 2000 and 2010, slightly more than the 2000 market share 23.7%. Attached housing represented a minus 4.3% of the new housing.
Despite being only the fourth largest metropolitan area, Dallas-Fort Worth accounted for 46% of the new housing in the five largest metropolitan areas (Figure 3).
The three largest metropolitan markets where there was an increase in multi-unit housing share were San Jose, New Orleans and Denver. In San Jose, 55.5% of new housing was multi-unit, while only 10.3 percent was detached. New Orleans had a similar 10.5% detached new housing share, while 65.8% of the new housing was multi unit. In Denver, 31.3% of the new housing was multi-unit, while 60.2% was detached.
The share of detached housing also declined between 2000 and 2010 in Boston, Kansas City, Minneapolis-St. Paul and Portland. In each of these metropolitan areas, the share of attached housing increased, while the share of multi-unit housing decreased. Nonetheless, detached housing continued to attract a majority of new housing in Kansas City (70.8 percent) and Portland (56.6 percent). Despite Portland's strong planning emphasis on high density housing, its share of multi-unit housing, and 26.8% between 2000 and 2010 was less than its 2000 market share of 27.5%, with a strong 20.6 percent share in attached housing. Attached housing also accounted for a comparatively large share of new housing in Boston (45.7 percent), Minneapolis-St. Paul (39.7 percent) and Kansas City (25.8 percent). The stronger densification policies that existed in Minneapolis-St. Paul until the middle of the decade may have artificially raised the share of attached new housing.
Share by housing type data is provided for the major metropolitan areas in Tables 1 and 2.
| Table 1 | ||||
| Occupied Housing by Major Metropolitan Area: 2000 | ||||
| Metropolitan Area | Detached | Attached | Multi-Unit | Other |
| Atlanta, GA | 66.6% | 3.5% | 25.5% | 4.4% |
| Austin, TX | 57.7% | 3.7% | 32.1% | 6.6% |
| Baltimore, MD | 46.0% | 28.5% | 24.2% | 1.3% |
| Birmingham, AL | 68.3% | 2.6% | 17.9% | 11.2% |
| Boston, MA-NH | 48.9% | 4.4% | 45.4% | 1.3% |
| Buffalo, NY | 60.0% | 2.8% | 35.1% | 2.1% |
| Charlotte, NC-SC | 67.5% | 3.4% | 21.8% | 7.3% |
| Chicago, IL-IN-WI | 52.5% | 6.3% | 40.1% | 1.1% |
| Cincinnati, OH-KY-IN | 64.7% | 3.6% | 27.8% | 3.9% |
| Cleveland, OH | 65.7% | 5.5% | 27.7% | 1.2% |
| Columbus, OH | 62.8% | 5.5% | 29.1% | 2.6% |
| Dallas-Fort Worth, TX | 62.0% | 3.1% | 30.3% | 4.6% |
| Denver, CO | 60.9% | 7.8% | 29.0% | 2.3% |
| Detroit, MI | 70.5% | 5.5% | 20.7% | 3.3% |
| Hartford, CT | 60.0% | 5.2% | 34.1% | 0.8% |
| Houston, TX | 61.4% | 3.6% | 29.1% | 6.0% |
| Indianapolis. IN | 68.4% | 5.2% | 23.2% | 3.3% |
| Jacksonville, FL | 63.5% | 3.9% | 22.3% | 10.3% |
| Kansas City, MO-KS | 71.3% | 4.6% | 21.4% | 2.6% |
| Las Vegas, NV | 53.4% | 6.0% | 34.7% | 5.9% |
| Los Angeles, CA | 49.7% | 8.6% | 39.6% | 2.0% |
| Louisville, KY-IN | 70.7% | 2.1% | 22.2% | 5.0% |
| Memphis, TN-MS-AR | 69.1% | 3.8% | 22.8% | 4.2% |
| Miami, FL | 45.4% | 9.9% | 42.1% | 2.6% |
| Milwaukee,WI | 55.7% | 5.3% | 38.3% | 0.7% |
| Minneapolis-St. Paul, MN-WI | 62.8% | 7.7% | 27.4% | 2.0% |
| Nashville, TN | 64.9% | 4.4% | 24.4% | 6.2% |
| New Orleans. LA | 59.9% | 7.7% | 28.5% | 3.9% |
| New York, NY-NJ-PA | 36.9% | 6.5% | 56.3% | 0.4% |
| Oklahoma City, OK | 71.6% | 3.1% | 19.2% | 6.0% |
| Orlando, FL | 61.5% | 4.5% | 25.1% | 8.9% |
| Philadelphia, PA-NJ-DE-MD | 45.3% | 29.8% | 23.5% | 1.4% |
| Phoenix, AZ | 61.6% | 6.1% | 24.9% | 7.4% |
| Pittsburgh, PA | 68.8% | 6.5% | 20.4% | 4.4% |
| Portland, OR-WA | 63.8% | 3.3% | 27.5% | 5.5% |
| Providence, RI-MA | 54.3% | 2.9% | 41.6% | 1.2% |
| Raleigh, NC | 63.6% | 5.2% | 21.5% | 9.8% |
| Richmond, VA | 71.3% | 4.9% | 20.4% | 3.4% |
| Riverside-San Bernardino, CA | 67.0% | 5.1% | 18.6% | 9.3% |
| Rochester, NY | 65.7% | 4.3% | 26.5% | 3.5% |
| Sacramento, CA | 66.1% | 6.0% | 24.0% | 3.9% |
| Salt Lake City, UT | 67.0% | 4.8% | 25.4% | 2.8% |
| San Antonio, TX | 67.4% | 2.9% | 22.2% | 7.5% |
| San Diego, CA | 51.7% | 9.4% | 34.5% | 4.4% |
| San Francisco-Oakland, CA | 50.3% | 9.3% | 39.1% | 1.3% |
| San Jose, CA | 57.0% | 9.1% | 30.5% | 3.4% |
| Seattle, WA | 60.2% | 3.5% | 31.6% | 4.8% |
| St. Louis,, MO-IL | 70.2% | 3.1% | 21.9% | 4.8% |
| Tampa-St. Petersburg, FL | 58.4% | 4.6% | 25.7% | 11.4% |
| Virginia Beach-Norfolk, VA-NC | 61.4% | 10.4% | 25.2% | 3.0% |
| Washington, DC-VA-MD-WV | 47.6% | 19.4% | 32.1% | 0.8% |
| Average (Weighted) | 55.9% | 7.5% | 33.3% | 3.3% |
| Data from 2000 Census | ||||
| Metropolitan areas over 1,000,000 population as defined in 2010 | ||||
| Table 2 | ||||
| Occupied Housing by Major Metropolitan Area: 2010 | ||||
| Metropolitan Area | Detached | Attached | Multi-Unit | Other |
| Atlanta, GA | 69.2% | 5.3% | 22.7% | 2.7% |
| Austin, TX | 60.4% | 2.6% | 31.8% | 5.1% |
| Baltimore, MD | 47.4% | 27.3% | 24.2% | 1.1% |
| Birmingham, AL | 70.8% | 2.4% | 16.8% | 10.0% |
| Boston, MA-NH | 48.7% | 5.9% | 44.2% | 1.2% |
| Buffalo, NY | 62.3% | 2.9% | 33.0% | 1.8% |
| Charlotte, NC-SC | 68.9% | 5.1% | 20.4% | 5.6% |
| Chicago, IL-IN-WI | 54.2% | 7.6% | 37.1% | 1.1% |
| Cincinnati, OH-KY-IN | 68.9% | 4.8% | 23.2% | 3.1% |
| Cleveland, OH | 68.7% | 5.1% | 25.1% | 1.1% |
| Columbus, OH | 64.1% | 7.3% | 26.6% | 2.1% |
| Dallas-Fort Worth, TX | 65.9% | 3.1% | 27.4% | 3.6% |
| Denver, CO | 60.8% | 7.9% | 29.4% | 1.9% |
| Detroit, MI | 71.6% | 6.3% | 19.1% | 2.9% |
| Hartford, CT | 60.9% | 5.3% | 33.1% | 0.7% |
| Houston, TX | 65.1% | 3.5% | 26.0% | 5.3% |
| Indianapolis. IN | 71.3% | 5.0% | 21.1% | 2.6% |
| Jacksonville, FL | 66.3% | 4.8% | 21.3% | 7.6% |
| Kansas City, MO-KS | 71.3% | 6.4% | 20.1% | 2.2% |
| Las Vegas, NV | 60.9% | 5.4% | 29.9% | 3.8% |
| Los Angeles, CA | 51.0% | 8.0% | 39.0% | 1.9% |
| Louisville, KY-IN | 71.6% | 3.6% | 20.9% | 4.0% |
| Memphis, TN-MS-AR | 72.5% | 3.3% | 20.4% | 3.7% |
| Miami, FL | 47.0% | 10.8% | 40.0% | 2.1% |
| Milwaukee,WI | 56.2% | 6.5% | 36.5% | 0.8% |
| Minneapolis-St. Paul, MN-WI | 61.5% | 11.0% | 25.9% | 1.6% |
| Nashville, TN | 67.2% | 5.6% | 22.3% | 4.9% |
| New Orleans. LA | 65.1% | 6.1% | 24.6% | 4.2% |
| New York, NY-NJ-PA | 37.2% | 6.7% | 55.7% | 0.4% |
| Oklahoma City, OK | 74.3% | 3.0% | 17.1% | 5.6% |
| Orlando, FL | 64.1% | 5.5% | 23.4% | 6.9% |
| Philadelphia, PA-NJ-DE-MD | 46.6% | 28.5% | 23.7% | 1.3% |
| Phoenix, AZ | 67.2% | 4.8% | 22.2% | 5.8% |
| Pittsburgh, PA | 69.4% | 7.5% | 19.1% | 4.0% |
| Portland, OR-WA | 62.8% | 5.5% | 27.4% | 4.3% |
| Providence, RI-MA | 55.7% | 3.7% | 39.6% | 1.0% |
| Raleigh, NC | 65.4% | 8.0% | 20.5% | 6.2% |
| Richmond, VA | 73.2% | 4.9% | 19.0% | 3.0% |
| Riverside-San Bernardino, CA | 70.7% | 4.3% | 17.1% | 7.9% |
| Rochester, NY | 66.9% | 4.8% | 25.3% | 2.9% |
| Sacramento, CA | 68.8% | 5.6% | 22.6% | 3.0% |
| Salt Lake City, UT | 67.8% | 6.1% | 23.9% | 2.2% |
| San Antonio, TX | 70.8% | 2.2% | 21.1% | 5.9% |
| San Diego, CA | 53.0% | 9.0% | 34.5% | 3.5% |
| San Francisco-Oakland, CA | 50.7% | 9.4% | 38.8% | 1.1% |
| San Jose, CA | 54.3% | 10.7% | 32.0% | 3.0% |
| Seattle, WA | 60.5% | 4.2% | 31.5% | 3.8% |
| St. Louis,, MO-IL | 70.8% | 4.2% | 21.1% | 3.9% |
| Tampa-St. Petersburg, FL | 59.6% | 5.6% | 24.7% | 10.1% |
| Virginia Beach-Norfolk, VA-NC | 62.5% | 11.1% | 24.0% | 2.5% |
| Washington, DC-VA-MD-WV | 48.1% | 19.6% | 31.7% | 0.7% |
| Average (Weighted) | 57.8% | 7.9% | 31.5% | 2.8% |
| Data from 2010 American Community Survey | ||||
| Metropolitan areas over 1,000,000 population as defined in 2010 | ||||
In Housing, Preference Trumps Policy: The trend of the last decade is evidence of a continued preference of American households for detached housing. The results are remarkable for at least two reasons:
- The first is that there have been unprecedented policy initiatives to discourage, if not to prohibit the building of new detached houses. It seems likely that the miniscule new detached housing share in San Jose, for example, is a direct result of that metropolitan area's virtual prohibition of new detached housing, rather than any evidence that households have begun to prefer higher density housing. A small detached housing share in the face of a strong public policy bias toward higher density housing says nothing about preferences.
- Second; the media and wishful advocates of denser settlement patterns have continuously referred to detached housing as having been severely overbuilt during the housing bubble, while suggesting an imperative for households to move into multiunit, often rented housing. The new data, with the larger increase in multi-unit vacancy rates, indicates that there was at least as much overbuilding in more dense housing types as there was in detached housing.
Despite the expressed preferences of planners, academics and even many builders, American households continue to make their own decisions about housing.
Wendell Cox is a Visiting Professor, Conservatoire National des Arts et Metiers, Paris and the author of “War on the Dream: How Anti-Sprawl Policy Threatens the Quality of Life”
Lead photo: Houses in Los Angeles. Photograph by author.


You should post on the
You should post on the profiles for the blog. You can submit that it's crucial. Your blog traffic may build up your local minibus hire purse.
There is a lot of information here that can help any business get started with a successful social networking campaign!
Minibus hire newcastle and minibus hire York
JOB
I do wish there were more people like you around on the interwebs. Not many people are careful with their words, including myself sometimes.
muzike shqip
Lush Acres EC will be
Lush Acres EC will be accessible with Kupang LRT Station as well as Sengkang Bus Interchange. It is also right beside Tampines Expressway(TPE). Lush Acres EC is also near to Marina Country Club, Sengkang Riverside Park and Sheng Siong hypermart in Sengkang Central.
lajmi i fundit
Houses nowadays are very
Houses nowadays are very cheap for many people, I can not find a good house for my family for years. Hope there are some ways to live in this planet.
Ghe giam doc
SFH
If anything, the recent housing crisis is worst for multi-family non- rental housing. Once you are outside most pricey urban areas, the demand for non-SFH's drops off very quickly. Very few desire a multi-family unit over a SFH. Even in dense urban areas people prefer SFH's if they can get them. They may end up not buying it, but only because they cannot find an affordable one. The most expensive housing in the Lincoln Park neighborhood of Chicago are the few single family houses.
Back outside the city in the suburbs and rural areas where most people actually live, multi-family is for renters or for low income folks, for the most part. If you can afford a SFH you buy it, multi-family isn't even in the picture. If you have a very tight budget you look at some multi-family because they are cheaper, but you tell you realtor to keep looking for an affordable SFH. Now that prices are down overall, more SFH's are available at a lower price, so the multi-units will sell slower and will lose more value. Why urban planners ignore it, I don't know?
There are almost no places where a multi-family unit goes for as much as a SFH. Even when the market was at it height.
There are a lot of reasons people prefer SFH's. Your own yard (even if it is small), less noise, less chance of fire or water damage, less problems with rodents and insects (if the person in the next unit doesn't clean or is a firebug), the ability to remodel what you want without people interfering. SFH's aren't perfect, but have far fewer negatives then mult-family.
conventional wisdom
I submit that in the case of the national media the soi disant conventional wisdom is the result of reliance on the more vocal of the "planning professionals" (read: Agenda 21 proponents), and with those planning professionals, it is simply wishful thinking.
"planners"
That is probably true.
The worst ones are the ones who think they know better then everybody else. Thankfully in many areas of the country they have little or no power over development. I read the planners message boards and many are little dictators in waiting. You can see what happens in places where they do have some power like Portland. Housing people want becomes scarce and very expensive.