
It's been clear since the census 2011 estimates were released on December 21, 2011, that we are experiencing something of a demographic change, at least in the short run. Clearly growth is slowing down in part, many believe, due to economic reasons, as was the case during the 1930s as well as the 1970s.
But there may be a series of other of causes of recent population change which suggest it is quite possible the United States population is simply heading towards zero population growth far quicker than the Census had previously estimated. One key reason may be the slowdown in immigration. Whatever the cause, if these patterns are not reversed, we could start observing European like slow rates of population growth spreading in the next couple of decades.
The 2011 numbers estimated 4,008,000 total births in the United States, while a just released report by the Centers for Disease Control and Prevention (CDC) shows a provisional estimate of 3,978,000 births from June, 2010 to June, 2011—the first time this number has been under four million since 1999. This certainly may be attributed to the effects of the economic recession, but may be part of much larger demographic trends --- such as falling fertility rates of Hispanic women --- that eclipse economic fluctuations.
Here is a series of maps that highlight recent population changes for the 50 states. The District of Columbia is too small to be seen at this scale, but DC did have the fastest population growth rate from 2010 to 2011, at 2.16%. There are a variety of ways to present the same data, classifying and color coding, but it is always good to look at total numbers, and both absolute and relative change.
Map Figure One: Estimated Population by State as of July 1, 2011
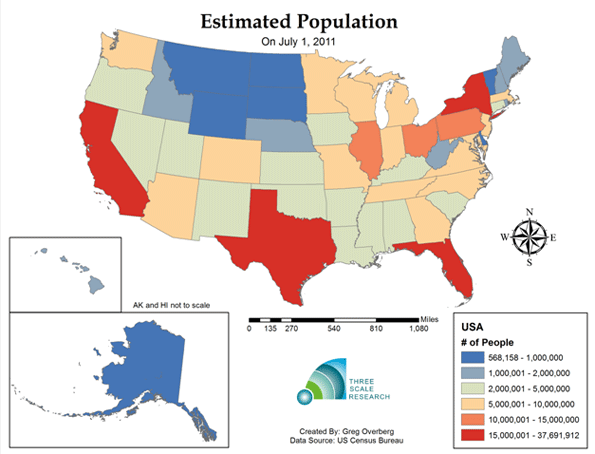
The United States now has a population of about 311 million persons, and four states (California, Texas, New York and Florida) exceed fifteen million persons. Combined, these top four states combined have 101.9 million people.
Map Figure Two: Estimated Absolute Change in Population from July 1, 2010 to July 1, 2011
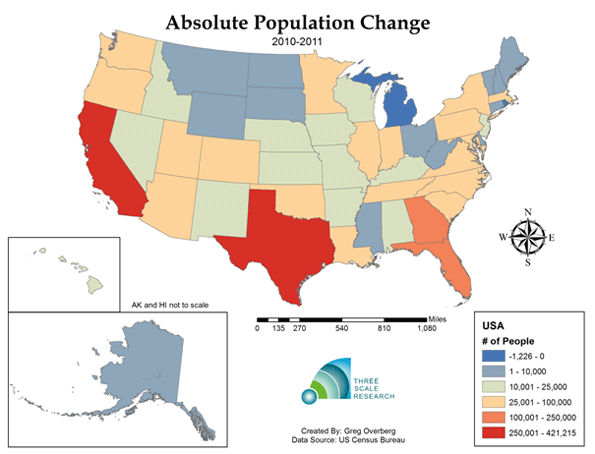
The second map shows the absolute change in population from July 1, 2010 to July 1, 2011 in six categories. Only one state, Michigan, lost population, but fourteen states added less than ten thousand persons. A total of twenty seven states added fewer than 25,000 persons. Four states added over 100,000 persons; Florida added 218,929 persons, while Georgia added 103,053 persons. California, although its population growth is slowing down, added 353,714 persons. Texas grew by the most people—421,215 persons—a rate that, if maintained, might result in the state surpassing 30 million people in the 2020 census. It still has a long way to go to catch up with California, which in 2011 has an estimated population of 37,691,912.
Map Figure Three: Estimated Relative Change in Population from July 1, 2010 to July 1, 2011
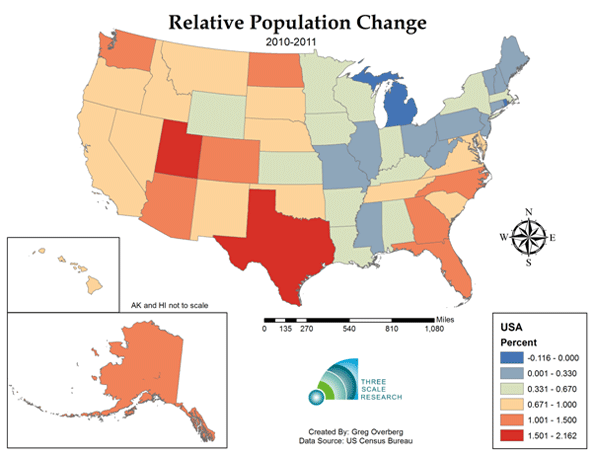
The third map shows relative percentage change. Although Michigan remains the only state to shrink, thirteen states are now growing less than a third of a percent a year, similar to many European Countries with very slow population growth. Overall, the United States population increased by 0.73 percent—a noticeable difference from 1970 through the 2000s, when population was consistently growing at about one percent per year. The highest rate of growth was Texas at 1.67 percent. Texas in 2011 is similar to Arizona and Nevada a few years back—states with both high absolute and relative population growth, and both positive domestic migration from other states and international migration from around the world. Texas is, for now, the most dynamic place for demographic change.
Map Figure Four: Estimated Relative Births minus Deaths (Natural Rate of Absolute Population Change) from July 1, 2010 to July 1, 2011
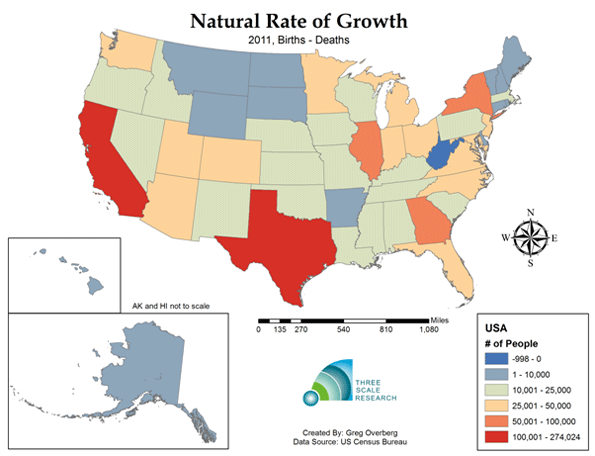
The natural rate of population growth (births minus deaths), was estimated at 1,557,874 persons from July 1, 2010 to July 1, 2011. A third of this growth occurred in two states, California and Texas, and Texas had the highest natural rate of absolute growth at 274,024 persons compared with 230,798 for California.
West Virginia is the first state to record more deaths than births, but a number of states are only a few years away from attaining this status that occurs at the end of the demographic transition process. In Ohio the natural rate of population growth is higher than the total rate, due to negative net migration, suggesting it is one of a number of states that could have modest population increase if it could cease losing people to other places.
Map Figure Five: Estimated Relative Births minus Deaths (Natural Rate of Relative Population Growth) from July 1, 2010 to July 1, 2011
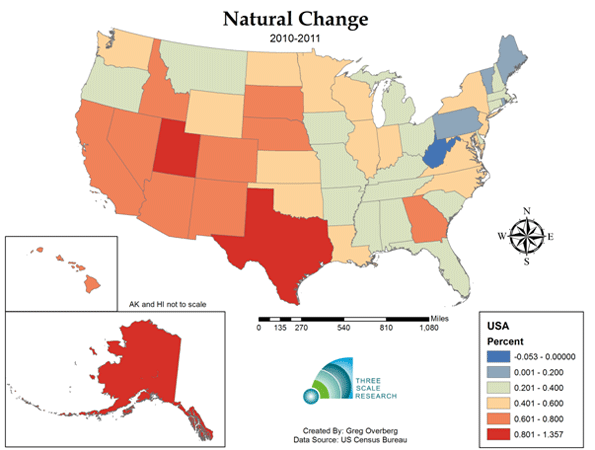
The fifth map shows what appears to be an East-West split. In the eastern thirty-one states, with the exception of Georgia, states have a natural rate of growth that is similar to other parts of the world with slowing or negative populations, including most of Europe, Russia, and East Asia. On the other hand, twelve out of nineteen western states have a natural rate of population growth exceeding 0.6 percent.
The highest rate of natural growth is in Utah, with an annual change of 1.36 percent, similar to the current population growth rate of India. Alaska also has a natural rate of increase above one percent, at 1.1 percent, and Texas, at 0.91 percent, has a similar rate of natural increase as the United States had for total population growth rate only a few years ago. The overall natural rate of increase for the United State is 0.5 percent per year, similar to China and France.
Map Figure Six: Estimated International Migration from July 1, 2010 to July 1, 2011
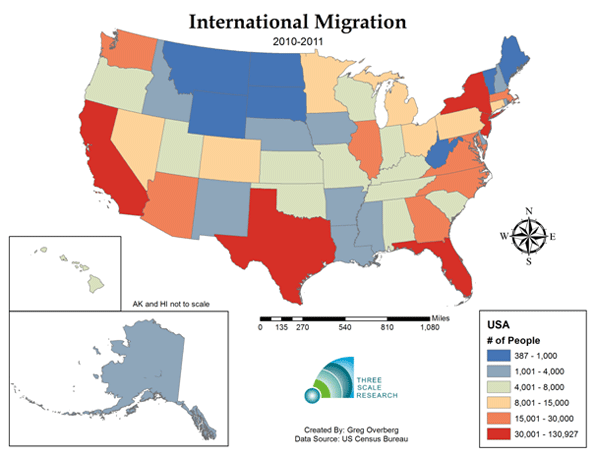
The sixth map shows that every state had international migration during 2010-2011. Most states number in the thousands, but five states, California, Texas, Florida, New York and New Jersey, have over thirty thousand migrants arriving.
Map Figure Seven: Estimated Domestic Migration from July 1, 2010 to July 1, 2011
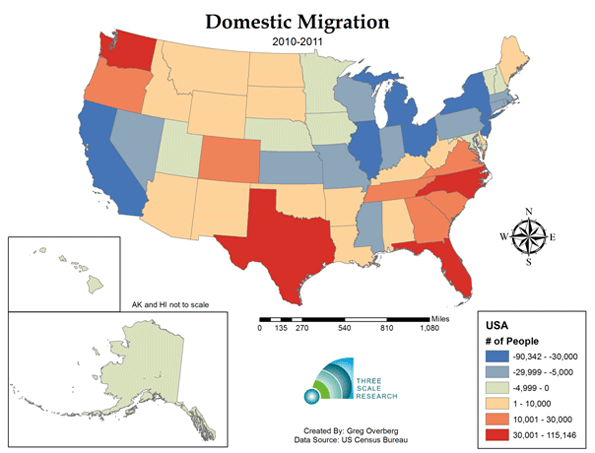
In contrast to the map of international migration, the seventh map shows domestic migration; the net effect of millions of Americans moving to different states during the course of a year. Twenty-four states show negative domestic migration, including all of the Midwest states except North and South Dakota. Texas and Florida experience both strong international and domestic migration, while California, New York and New Jersey have negative domestic migration and positive international migration.
Map Figure Eight: Estimated Net Migration (Combined International and Domestic) from July 1, 2010 to July 1, 2011
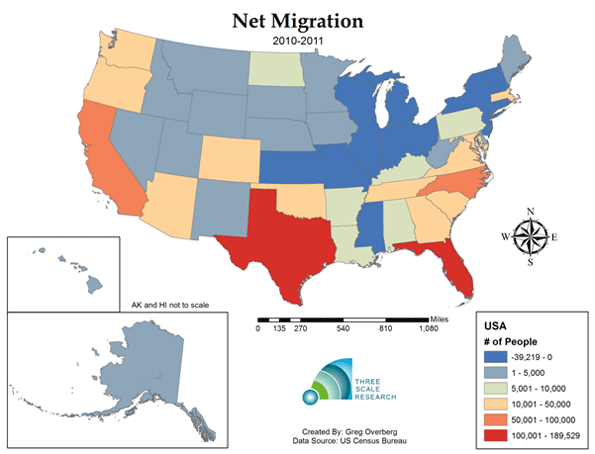
The eighth and final map shows the effects of net migration. States along the West Coast, the State of Texas, and the South Atlantic Region have all experienced net positive migration. A band of states mostly in the Midwest and Northeast have negative net migration, as their residents leave for other places. Migration patterns have been occurring for a long time, but what will be new is how migration occurs in the face of slowing overall natural rates of population change.
These numbers are, of course, just one year and it is entirely possible that growth will rise as the economy improves and as the current large millennial generation enters their prime child bearing years. But if the current one-year trend becomes a longer term phenomena, we could see a possible leveling off of population much sooner and at a lower rate than forecasted, say around 360 million by mid-century instead of 478 million by the year 2100 as forecast by the United Nations Population Division. These, will have implications for government fiscal policy, and will generate debate about government policy in encouraging births as we observe in Europe, Russia and Japan. Population growth has been a relative advantage for the United States and remains so, but we may have to consider whether this trend is inexorable.
Ron McChesney is a Geographer with Three Scale Strategy and Research in Columbus, Ohio. Ron received a PhD in Geography at The Ohio State University in 2008.
Greg Overberg is a City and Regional Planner with Three Scale Strategy and Research in Columbus Ohio. Greg received a MA in City and Regional Planning at The Ohio State University in 2011.


a study
This makes a lot of sense. The value of having children is no longer as prevalent in the United States as it was fifty years ago - Most people who are now in their twenties don't automatically say they want kids because they think that's what they're supposed to do. If you check out just about any dating site profile you'll see that most of the singles on those sites put that they don't want kids! Hopefully this will lead to more adoptions from other countries who seemingly have the opposite problem, but I'm a dreamer...