
The latest data (2011) from the Federal Bureau of Investigation (FBI) Uniform Crime Reports (UCR) indicates that violent crime continued to decline in both the suburbs and historical cores of major metropolitan areas (over 1,000,000 residents). Since 2001, the rates of decline have been similar, but contrary to media reports, the decline has been slightly greater in the suburbs than in the historical cores. Moreover, despite the preliminary report of a slight increase in the violent crime rate at the national level in 2012, substantial progress has been made in making the nation safer over the past 20 years.
Major Metropolitan Area Trends
The FBI website includes complete data on 48 of the 51 major metropolitan areas for 2011 (2012 data are not yet available for metropolitan areas). The FBI notes that the data collection methodology for the city of Chicago and the suburbs of Minneapolis-St. Paul is inconsistent with UCR guidelines and as a result, the FBI does not include information for these jurisdictions. No data is reported for Providence.
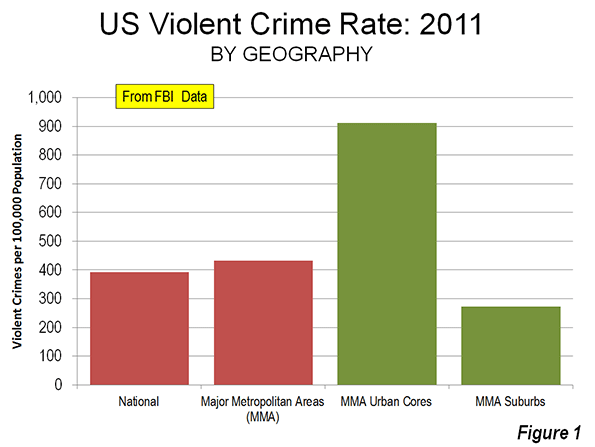
Among these 48 major metropolitan areas, the violent crime rate was 433 (offenses per 100,000 population known to the police), approximately 10% above the national rate of 392 in 2011. The violent crime rate in the historical core municipalities, or urban core (See Suburbanized Core Cities) was 911 offenses per 100,000 population. In the suburbs, which consist of all municipalities not comprising the historical cores, the violent rate was 272 offenses per 100,000 population. Thus, the urban core violent crime rate was 3.3 times the suburban violent crime rate (Figure 1).
A comparison of the urban core and suburban crime rates by historical core municipality classification further illustrates the lower crime rates generally associated with more suburban areas. The violent crime rates in the more suburban urban cores are generally lower (Table 1).
- Among metropolitan areas with “Post-War & Suburban Core Cities,” the urban core violent crime rate in 2011 was 2.2 times that of the suburbs. This would include core cities such as Phoenix, San Jose, Austin and others that became large metropolitan areas only after World War II and the broad expansion of automobile ownership and detached, low density housing.
- In the metropolitan areas with “Pre-War & Suburban Core Cities,” the urban core violent crime rate was 3.1 times that of the suburbs. These would include core cities such as Los Angeles, Seattle, and Milwaukee, which combine a denser pre-war inner city with large swaths of post-World War II suburban development within their borders.
- The greatest difference was in the metropolitan areas with “Pre-War & Non Suburban Core Cities,” where the urban core violent crime rate was 4.4 times that of the suburbs. These would include such core cities as New York, Philadelphia, Boston and others, which had large areas of high density and significant central business districts before World War II, and which, even today, have little post-World War II suburban development within their borders.
| Table | ||||
| VIOLENT CRIME RATES: HISTORICAL CORE MUNICIPALITIES AND SUBURBS: 2011 | ||||
| Violent Crimes Reported per 100,000 Population In Major Metropolitan Areas | ||||
| Historcial Core Municipality Classification | Metropolitan Area | Urban Core | Suburbs | Urban Core Times Suburbs Crime Rate |
| Pre-War Core & Non-Suburban | 436 | 1,181 | 273 | 4.3 |
| Pre-War Core & Suburban | 443 | 821 | 265 | 3.1 |
| Post War Suburban Core | 398 | 642 | 294 | 2.2 |
| 48 Major Metropolitan Areas | 433 | 911 | 272 | 3.3 |
| No data for Chicago, Minneapolis-St. Paul and Providence | ||||
Suburban and Urban Core Trends: 10 Years
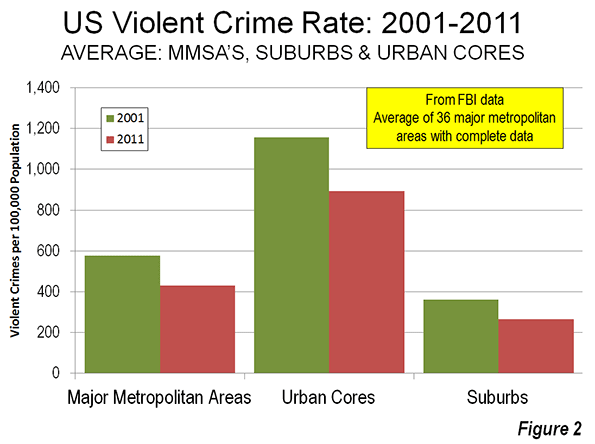
Over the past decade, violent crime fell both in the suburbs and the urban cores. Among the 36 major metropolitan areas for which complete and comparable data is provided on the FBI website, the violent crime rate fell an average of 25.8 percent between 2001 and 2011. Urban core violent crime rates were down 22.7 percent, while suburb violent crime rates were down a slightly less 26.7 percent (Figure 2).
Reconciling Differences with Other Analyses
Other analyses have noted that urban core crime rates are declining faster than in the suburbs. The differences between this and other analyses are due to the use of different time periods, different metropolitan area sets, and most importantly, profoundly more limited definitions of the suburbs.
An article in The Wall Street Journal raising concerns about suburban crime rates was based on an FBI analysis of all metropolitan areas, not just major metropolitan areas and covered 2001 to 2010. Crucially, the FBI classifies much of suburbia as not being suburbs. The FBI defines suburbs generally as any municipality in a metropolitan area with fewer than 50,000 residents as well as areas patrolled by county law enforcements agencies. Non-core municipalities with their own law enforcement that have 50,000 or more residents are not considered suburbs, regardless of their location in the metropolitan area. This would mean, for example, that Pomona would not be considered a suburb, despite its location 30 miles from Los Angeles City Hall, on the very edge of the metropolitan area, simply because it has more than 50,000 residents. As a result, the crime rates in “cities” versus suburbs cannot be determined by simply comparing FBI geographical classifications.
A Brookings Institution report reported suburban violent crime rates to be dropping more slowly than in “primary cities,” which are a subset of the “principal cities” defined by the Office of Management and Budget (OMB). Many of these primary cities are virtually all post-World War II suburban in form. These include, for example, Mesa, Arizona, Arlington, Texas and Aurora, Colorado, each of which had fewer than 10,000 residents in 1950 and are virtually exclusively the low-density, automobile oriented suburban development forms that would be found in nearby Tempe, Grand Prairie, and Centennial, which are defined as “suburban” in the Brookings classification. The Brookings report looked at major metropolitan areas as well as smaller metropolitan areas and covered a longer period (1990 to 2008).
OMB, which defines metropolitan areas, does not designate any geography as suburban. OMB specifically excluded “suburban” terminology from its 2000 metropolitan area criteria. Instead, in recognition of the increasing polycentricity of metropolitan areas, OMB began designating “principal cities.” Except for the largest city in a metropolitan area, principal cities are defined by the strength of their employment markets, and are generally suburban employment centers, not urban cores. In defining its metropolitan area criteria for the 2000 census, OMB recognized that the monocentric city (metropolitan area) had given way to an urban form with multiple employment centers, located throughout the metropolitan area.
OMB’s principal cities may be located anywhere in the area, without any relationship to the urban core. Rather than a single core city in a metropolitan area, OMB has designated up to 25 principal cities in a single metropolitan area.
The National Trend
The metropolitan area crime reductions are consistent with a now two-decade trend of substantially improving crime rates. This is despite preliminary data recently released by the FBI in June indicating a reversal of the trend for 2012. The FBI reported violent that violent crime increased 1.2 percent. With a 0.7 population increase from 2011 to 2012, the US violent crime rate would increase to 394 per 100,000 residents, from 392 in 2011. Metropolitan area data for 2012 is not yet available.
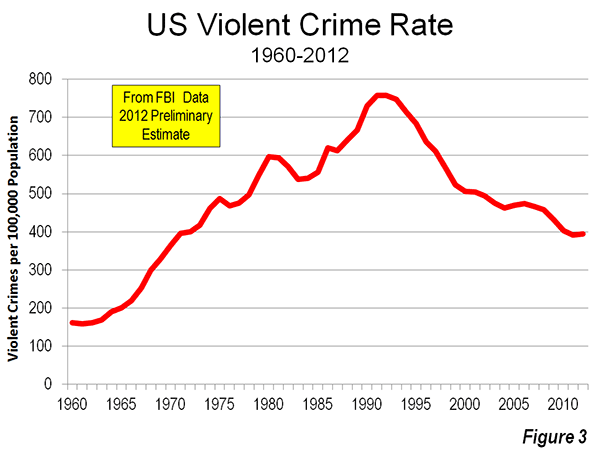
This increase in crime rates should be a matter of concern. The 2012 violent crime rate increase is, hopefully, only a blip in a decline that will soon resume. The violent crime rate has declined eighteen of the last 21 years. Since 1991, the violent crime rate has dropped by nearly half (48.3%).
This is in stark contrast with the previous 30 years, during which the violent crime rate increased in all but five years. By 1991, the violent crime rate had increased 3.7 times from 1961. By 2012, the national violent crime rate had fallen to the lowest level since 1970 (Figure 3).
Why Has the Crime Rate Declined?
There are multiple theories about the causes of the crime rate reduction. The late James Q. Wilson, who with George Kelling advanced the “broken windows” theory of crime prevention, offered a number of additional reasons for the fact that crime rates remained much lower, even during the Great Recession, in a Wall Street Journal commentary. The earliest and best publicized improvements in crime rates occurred under New York Mayor Rudolph Giuliani in the 1990s. Kelling and others (such as Hope Corman of Rider University and Naci Mocan of Louisiana State University) attribute much of the crime rate improvement in New York City to the “broken windows” deterrence strategies.
The substantial decline in violent crime rates, in the nation, metropolitan areas, suburbs and urban cores, are an important success story. Yet, crime rates can never be too low. It can only be hoped that future years will see even greater reductions.
Wendell Cox is a Visiting Professor, Conservatoire National des Arts et Metiers, Paris and the author of “War on the Dream: How Anti-Sprawl Policy Threatens the Quality of Life.
Crime scene photo by Alan Cleaver.


