
The suburbs of major metropolitan areas captured the overwhelming majority of population growth between 2000 and 2010, actually increasing their share of growth, as has been previously reported. However, it is often not understood that much of the recent central city (Note 1) growth has actually been suburban in nature, rather than core densification. In fact, historical core cities (Note 2) vary substantially. In some cases, core cities are largely pre-war and transit oriented, such as New York, Chicago and San Francisco. In other cases, much of historical core city is automobile oriented suburban in character. This article provides a classification of historical core cities based upon the extent of their pre-automobile cores as well as population and land area data.
Central Cities before World War II: Auto-oriented suburbanization began before the Great Depression. In 1940, transit's urban market share in the United States appears to have been higher than that of Western Europe today (Note 3). Each of the nation's largest metropolitan areas (then called "metropolitan districts") boasted a strong, dense core, and could be generally delineated by the city limits of the largest municipality.
In the years after the Second World War, many cities annexed considerable territory. At the same time, a number of new major metropolitan areas emerged which effectively lacked a dense core. For the purposes of analysis, the historical core cities of the 51 major metropolitan areas (those with more than 1,000,000 population) have been divided into three categories, based upon the extent of the suburban development within their borders. The categories are defined in Table 1 and data is provided in Tables 2 and 3 in the attached PDF document.
|
Table 1 |
||
|
Nature of Historical Core Municipality: |
Large Urban Core in 1940? |
2010 |
|
Pre-War & Non-Suburban |
Yes |
Is pre-war core; nearly all included land area was developed by 1940. Little development that is post-war suburban in character. Little or no change in boundaries since 1940. |
|
Pre-War & Suburban |
Yes |
Includes pre-war core, however contains substantial development that is post-war suburban in character (2010 boundaries contain substantial areas that were greenfield in 1940) |
|
Post War & Suburban |
No |
Has smaller pre-war core: less than 100,000 population in 1940 and nearly all development is post-war suburban in character. |
|
The historical core municipality is the municipality with the largest 1940 population in the present metropolitan area (metropolitan statistical area). |
||
Pre-War & Non Suburban: The first category is the "Pre-War & Non Suburban" historical core cities. Each of these 19 cities is itself a pre-automobile core. City boundaries have changed little since before World War II and nearly all land was developed at that time (Note 3).
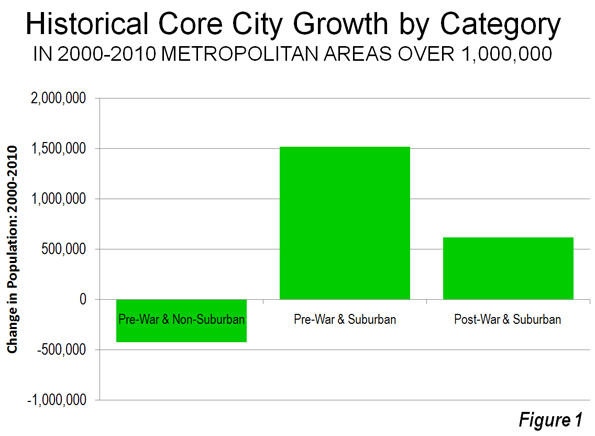
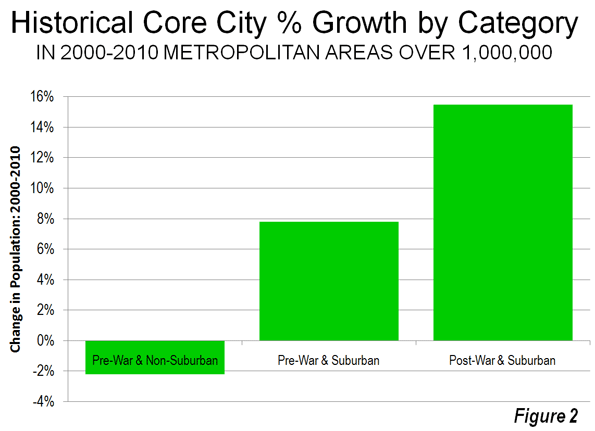
Overall, these cities had a population density of 11,900 per square mile in 2010 (Figure 1). However, 16 of the cities have lost population since 1940, with only New York, San Francisco and Oakland having gained population, albeit very modestly. (Oakland lost population over the past decade.) Between 2000 and 2010 the "Pre-War & Non Suburban" historical core cities lost 424,000 people, or 2.2 percent of their population (Figures 2 and 3). Seven gained population, though in five of these cases (Boston, Hartford, Philadelphia, Providence and Washington) the 2010 population remained well below mid-century levels.

Pre-War & Suburban: The second category is the "Pre-War & Suburban" historical core cities. These 27 cities had pre-automobile cores, usually quite small, in 1940, but also include (in their 2010 borders) substantial land that was undeveloped in 1940. Substantial automobile-oriented suburban development has occurred in these areas. The strong automobile oriented suburban influence is indicated by the average population density of 2900 people per square mile of land area, approximately one-fourth the density in the "Pre-War & Non Suburban" category.
On average, the 2010 land area of the "Pre-War & Suburban" historical core cities is 3.2 times the land area of the corresponding urban areas in 1950 (areas of continuous development or the "urban footprint"). These urban areas included both the historical core city and the suburbs (Note 4). The city of Jacksonville covers the most land area relative to its 1950 urban area, at 14.7 times. The city of Portland, the recipient of frequent praise by advocates of densification, covered more area in 2010 than its entire urban area in 1950 and its population density today is less than that of the entire urban area in 1950.
The "Pre-War & Suburban" historical core cities added 1,520,000 people between 2000 and 2010. This translates into an average growth of 7.8 percent relative to the 2000 population. Three cities grew more than 100,000. Louisville added 341,000 people principally through a city – county merger, after its previous annexations had failed to stop its population decline. Between 1950 and 2000, Louisville has lost nearly one-third of its population while adding more than 50 percent to its land area.
Charlotte added 191,000 people, principally due to a continuing annexation program. San Antonio and Houston took advantage of considerable undeveloped land within their city limits to add 183,000 and 146,000 people respectively.
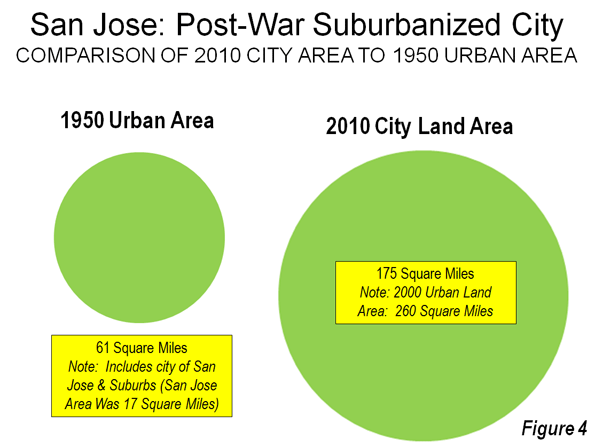
Post-War & Suburban: The third category is the "Post-War & Suburban" historical core cities. None of these seven cities had more than 100,000 population in 1940 or a large pre-automobile core; these are essentially suburbanized cities. In each case, the cities have undertaken huge annexations. On average, the 2010 city limits include nearly 6 times as much land as the corresponding urban areas in 1950. The city of San Jose, known for its densification policies, covers nearly 3 times as much land as its entire urban area in 1950, which included the city and all of the suburbs (Figure 4).
The "Post-War & Suburban" historical core cities added 619,000 people between 2000 and 2010, for an increase rate of 15.5 percent, the largest percentage growth of the three categories.
Perhaps surprisingly the population density of the "Post-War & Suburban" historical core cities was one-quarter above that of the "Pre-War & Suburban" category, at 3700 per square mile. This may be at least partially driven cities like San Jose, Las Vegas and Riverside-San Bernardino, which have generally avoided planning that required larger lots and below market densities.
The cities of Philadelphia and Phoenix reflect these differing patterns. In 2010 Philadelphia had a population density of more than 11,300 people per square mile and covered an area of 135 square miles. The city of Phoenix had a population density of under 3000 people per square mile and covered more than 500 square miles. Not even one square mile of the 2010 city of Phoenix equals the average density of Philadelphia. In 1940, Philadelphia had a population of 1.9 million, 30 times that of the 65,000 in Phoenix.
As would be expected in a dense historic core city, Philadelphia has a substantial transit work trip market share, at 25 percent. This is five times that of the surrounding suburbs (5 percent). In contrast, the city of Phoenix has s a transit work trip market share of only three percent, below that of the Philadelphia suburbs.
Suburban Development Makes Cities Grow: As the data above indicates, virtually all net core city population growth over the past decade has been suburban in nature. Core cities characterized by substantial automobile-oriented suburbanization added more than 2.1 million residents, while the cities with little automobile-oriented suburbanization lost more than 400,000. It turns out that even most “core” cites are more suburban than many imagine.
--------------------
Note 1: "City" has multiple meanings and analysts have not always provided sufficient clarity when using the term. For example, "city" can mean a metropolitan area, and urban area, a municipality (incorporated jurisdiction) or as in China, a region either at the provincial or sub-provincial level. As used in this article, the term "city" means a municipality unless otherwise indicated.
Note 2: The historical core city is the city in the present metropolitan area that had the largest population in 1940. Usually, this is the first named city in the official Census Bureau title. However, in two cases (Virginia Beach-Norfolk and Riverside-San Bernardino), the second named city is the historical core city because it was the largest in 1940.
Note 3: There are no comparable data on overall transit market shares between Europe and the United States. However, Eurostat data for nearly 150 European metropolitan areas indicates that transit's work trip market share averages approximately 17 percent. The same population range (over 100,000) of US metropolitan areas has a transit work trip market share of six percent. In 1940, the overall US transit market share was approximately 14 percent. Because transit work trip market shares are generally substantially higher than overall shares, it is suggested that the 1940 US transit market share was greater than the current share in Europe.
Note 4: The city of Chicago made a substantial annexation largely to incorporate the land for O'Hare International Airport. This annexation did not materially increase post-war suburban development in Chicago and the city is thus classified as "Pre-War & Non-Suburban."
Note 5: 1950 used because urban areas were not designated before that time.
Wendell Cox is a Visiting Professor, Conservatoire National des Arts et Metiers, Paris and the author of “War on the Dream: How Anti-Sprawl Policy Threatens the Quality of Life”
Photo: City of San Antonio annexation map from the San Antonio Planning and Development Department. The red rectangle is the land area of the city in 1940.
| Attachment | Size |
|---|---|
| Suburbanized-Core-Cities-Cox.pdf | 24.08 KB |


