The major metropolitan areas of the United States experienced virtually all of their overall growth in suburban and exurban areas between 2000 and 2010. This is the conclusion of an analysis of the functional Pre-Auto Urban Cores and functional suburban and exurban areas using the Demographia City Sector Model.
The City Sector Model
The City Sector Model classifies zip code areas in the major metropolitan areas based on urban form (Note 1). These include four classifications, one of which replicates the urban form and travel behavior typical of the pre-World War II urban cores. These areas were typically higher density and dependent on transit and walking. The City Sector Model has three other classifications, Pre-Auto Urban Core, Auto-Suburban: Earlier, Auto-Suburban: Later and Auto-Exurban.
For simplicity the City Sector categories are referred to as urban core, earlier suburban, later suburban and exurban. The City Sector Model is described in a previous article, and illustrated in Figure 1, which is also posted to the internet.
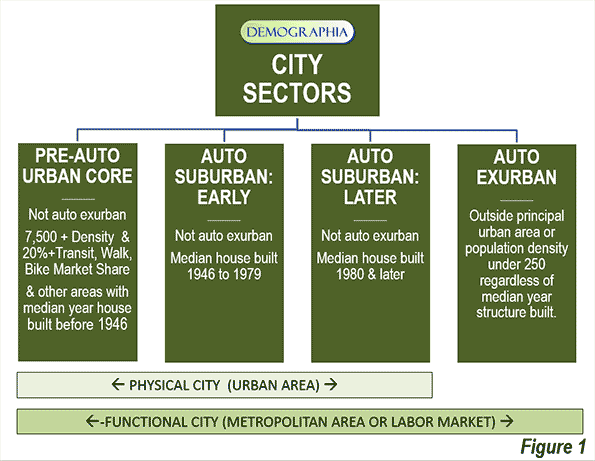
The model makes it possible to analyze metropolitan areas based on smaller area functional classifications, rather than on jurisdictional (historical core municipality) borders, which among other things, mask as core large areas of suburbanization.
Suburbanized Core Municipality Examples: San Jose and Charlotte
This suburbanization in the historical core municipalities is illustrated by examples like San Jose and Charlotte. The City Sector Model indicates that neither of these metropolitan areas has a pre-auto urban core. This is because neither metropolitan area has a large enough concentration of houses with a median construction date of 1945 or before or sufficient area of 7,500 population density per square mile (2,900 per square kilometer) with a transit, walking and cycling work trip market share of at least 20 percent. As a result, virtually all of both metropolitan areas is automobile oriented suburban, including virtually all of the core municipalities.
This is true in Charlotte despite its development of one of the most impressive new central business districts in the nation, with high employment densities. Yet at the same time the core city of Charlotte itself is very low density (2010), at 2,500 per square mile (950 per square kilometer), less than the suburban area average for large US urban areas (2,600 per square mile or 1,000 per square kilometer). Charlotte, however, could develop the equivalent of a pre-auto urban core if its central population density rises enough and enough commuters use transit, walking and cycling.
The core city of San Jose is far more dense than Charlotte, at 5,800 per square mile (2,200 per square kilometer). However, it is less dense than the suburbs of Los Angeles (6,400 per square mile or 2,500 per square mile). Like Charlotte, the core city of San Jose is virtually all automobile oriented suburban and has a transit work trip market share a full third below the major metropolitan area average.
Overall Population Trend: 2000-2010
These phenomena reflect national trends, All major metropolitan area growth between 2000 and 2010 (100.9 percent) was in the functional suburbs and exurbs.
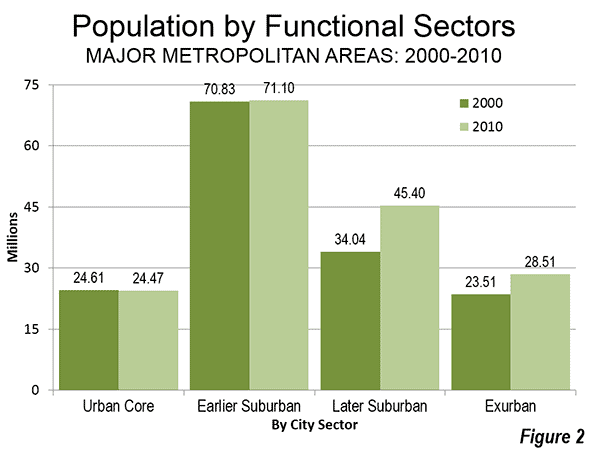
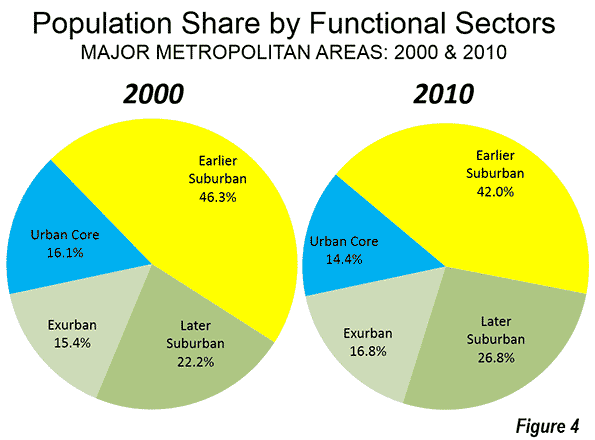
Between 2000 and 2010, the percentage of major metropolitan area population in the urban cores declined from 16.1 percent to 14.4 percent. The urban cores lost approximately 140,000 residents (a loss of 0.6 percent), despite strong gains very close to the centers of the historical core municipalities. Consistent with these findings, Census Bureau analysis showed that the focused gains in the cores of the urban cores were more than negated by losses in surrounding urban core areas (described in: Flocking Elsewhere: The Downtown Growth Story).
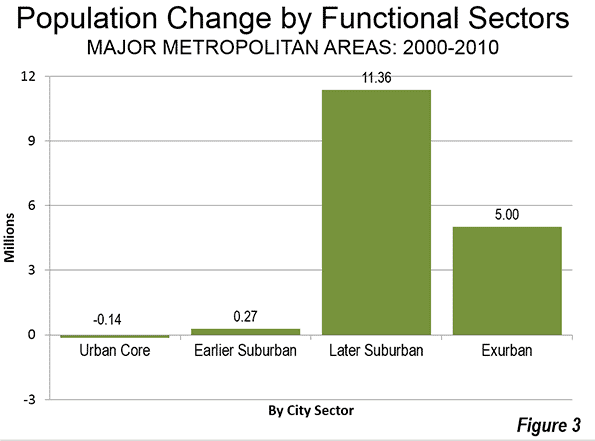
The earlier suburban areas gained only modestly, adding 280,000 new residents, for a 0.4 percent increase. These areas have median house construction dates between 1946 and 1979. The largest increase was in the later suburban areas, which added the most new residents, 11.4 million, for a gain of 33.4 percent. The later suburban areas have median house constructions of 1980 or later. Exurban areas added 5.0 million residents, for a gain of 21.3 percent. Exurban areas are located outside the principal urban areas (Figure 2).
Overall, the later suburban and exurban areas gained 16.4 million residents, compared to the combined gain of 130,000 in the urban cores and earlier suburban areas. Thus, more than 99 percent of the population growth in the major metropolitan areas was in the later suburban and exurban areas (Figure 3).
During the decade, the exurban areas overtook the urban cores in population, rising from 15.4 percent of the major metropolitan area population to 16.8 percent (Figure 4).
Contrast with 1990-2000 Population Trend
Despite all of the talk of an urban core renaissance, the 2000 to 2010 decade was less favorable for urban cores than the 1990 to 2000 decade. In the earlier decade, the urban cores (as defined in 2010) added 960,000 residents, for a growth rate of 4.0 percent. This compares to the 140,000 urban core loss between 2000 and 2010 (Note 2).
Virtually all of the difference was attributable to urban core population trend reversals in New York, Boston and Chicago, which combined experienced a drop in growth of 1.1 million. Between 1990 and 2000, the urban core of New York added 779,000 residents, far more than the 190,000 added between 2000 and 2010. Boston's 1990-2000 urban core growth was 296,000, but fell to 27,000 in the last decade. Chicago's urban core dropped from a gain of 139,000 to a loss of 175,000.
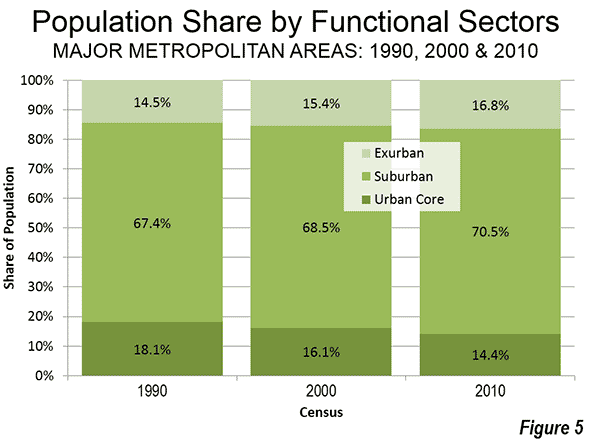
Over the past twenty years, the population of urban cores has diminished relative to that of major metropolitan areas. In 1990, the urban cores represented 18.1 percent of the population, but fell to 14.1 percent in 2010. Auto-oriented areas (suburban and exurban) have increased their combined share from 81.9 percent of the major metropolitan area population in 1990 to 85.6 percent in 2010 (Figure $$$).
Summary of Individual Metropolitan areas
In 30 of the 52 major metropolitan areas, all or more of the population growth was in suburban and exurban areas between 2000 and 2010. This includes the metropolitan areas that do not have Pre-Auto Urban Cores.
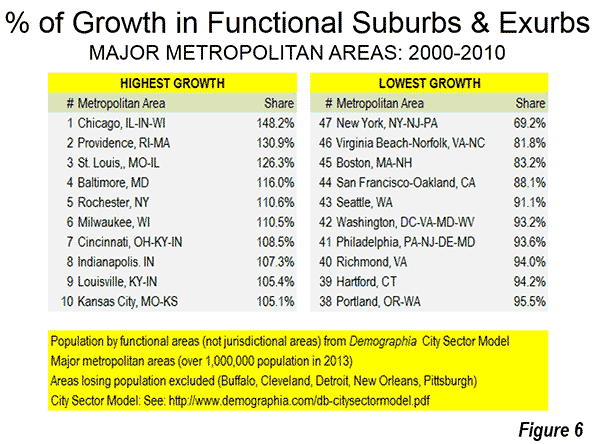
Chicago had the largest share of suburban and exurban population growth, at 148 percent. This occurred because of the substantial urban core population losses. The suburbs and exurbs of Providence captured 131 percent of its growth, slightly more than the 126 percent suburban and exurban share in St. Louis. Baltimore, Rochester and Milwaukee had more than 110 percent of their growth in the suburbs and exurbs. Cincinnati, Indianapolis, Louisville, and Kansas City rounded out the largest suburban and exurban growth shares, all over 105 percent.
Despite the substantial decline in its urban core growth in the last decade, New York had the lowest share of population growth in the suburbs and exurbs (meaning that it had the highest share of population growth in the urban core). The suburbs and exurbs of New York captured only 69 percent of the metropolitan area growth, well below second place, Virginia Beach – Norfolk (81 percent). Boston was next at 83 percent, followed by San Francisco – Oakland, at 88 percent. The bottom 10 in suburban and exurban growth share also included Seattle, Washington, Philadelphia, Richmond, Hartford and Portland. Even so, each of these six metropolitan areas had more than 90 percent of their growth in suburban and exurban areas (Figure 6).
Jurisdictional Analyses: Suburbs Masquerading in Cities
The functional analysis based on urban form and behavior reveals substantially different trends compared to the conventional jurisdictional analysis that compares historical core municipalities, principal cities or primary cities to the balance of metropolitan areas. For example a jurisdictional analysis shows that core municipalities added 1,290,000 residents between 2000 and 2010. In contrast, the urban cores, as indicated in the functional analysis, lost 140,000 residents. This indicates the extent of to which municipal boundaries can mislead in the analysis of urban form within metropolitan areas. The expansive city limits of most core cities masks the substantial automobile oriented suburbanization within their own borders.
----
Note 1: The City Sector Model is generally similar to the groundbreaking research published by David L. A. Gordon and Mark Janzen at Queen's University in Kingston Ontario (Suburban Nation: Estimating the Size of Canada's Suburban Population) with regard to the metropolitan areas of Canada. Gordon and Janzen concluded that the metropolitan areas of Canada are largely suburban. Among the major metropolitan areas of Canada, the Auto Suburbs and Exurbs combined contain 76 percent of the population, somewhat less than the 86 percent found in the United States.
Note 2: Changes in zip code definitions and boundaries could result in minor differences in comparability between the three censuses.
----
Wendell Cox is principal of Demographia, an international public policy and demographics firm. He is co-author of the "Demographia International Housing Affordability Survey" and author of "Demographia World Urban Areas" and "War on the Dream: How Anti-Sprawl Policy Threatens the Quality of Life." He was appointed to three terms on the Los Angeles County Transportation Commission, where he served with the leading city and county leadership as the only non-elected member. He was appointed to the Amtrak Reform Council to fill the unexpired term of Governor Christine Todd Whitman and has served as a visiting professor at the Conservatoire National des Arts et Metiers, a national university in Paris.
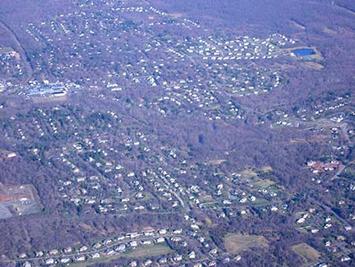
Photo: Later Suburbs in New York Urban Area (Morris County, New Jersey), by author


