
The United States Census Bureau has released a report (Patterns of Metropolitan and Micropolitan Population Change: 2000 to 2010.) on metropolitan area growth between 2000 and 2010. The Census Bureau's the news release highlighted population growth in downtown areas, which it defines as within two miles of the city hall of the largest municipality in each metropolitan area. Predictably, media sources that interpret any improvement in core city fortunes as evidence of people returning to the cities (from which they never came), referred to people "flocking" back to the "city" (See here and here, for example).
Downtown Population Trends: Make no mistake about it, the central cores of the nation's largest cities are doing better than at any time in recent history. Much of the credit has to go to successful efforts to make crime infested urban cores suitable for habitation, which started with the strong law enforcement policies of former New York Mayor Rudy Giuliani.
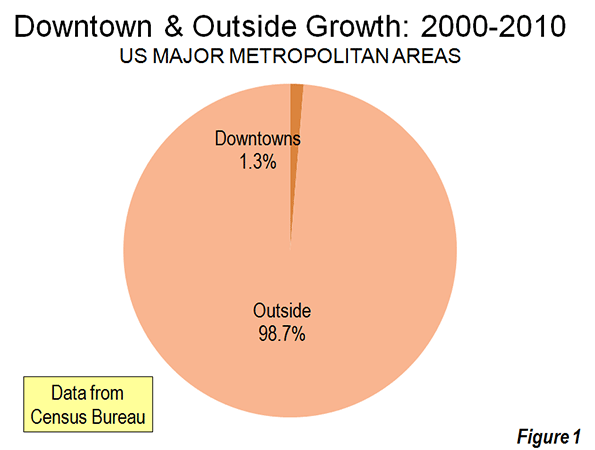
However, to characterize the trend since 2000 as reflective of any "flocking" to the cities is to exaggerate the trend of downtown improvement beyond recognition. Among the 51 major metropolitan areas (those with more than 1 million population), nearly 99 percent of all population growth between 2000 and 2010 was outside the downtown areas (Figure 1).
There was population growth in 33 downtown areas out of the 51 major metropolitan areas. As is typical for core urban measures, nearly 80 percent of this population growth was concentrated in the six most vibrant downtown areas, New York, Chicago, Philadelphia, Washington, Boston and San Francisco.
If the next six fastest-growing downtown areas are added to the list (Dallas-Fort Worth, Houston, Los Angeles, Portland, San Diego and Seattle), downtown growth exceeds the national total of 205,000 people, because the other 39 downtown areas had a net population loss. Overall, the average downtown area in the major metropolitan areas grew by 4000 people between 2000 and 2010. That may be a lot of people for a college lacrosse game, but not for a city. While in some cases these increases were substantial in percentage terms, the population base was generally small, which was the result of huge population losses in previous decades as well as the conversion of old disused office buildings, warehouses and factories into residential units.
Trends in the Larger Urban Cores: The downtown population gains, however, were not sufficient to stem the continuing decline in urban core populations. Among the 51 major metropolitan areas, the aggregate data indicates a loss of population within six miles of city hall. In essence, the oasis of modest downtown growth was more than negated by losses surrounding the downtown areas. Virtually all the population growth in the major metropolitan areas lay outside the six mile radius core, as areas within the historical urban core, including downtown, lost 0.4 percent.
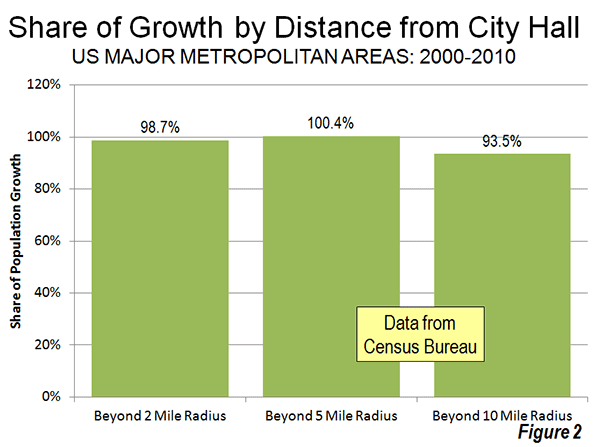
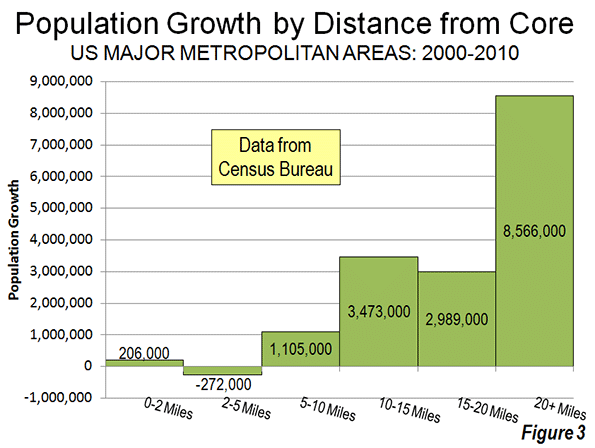
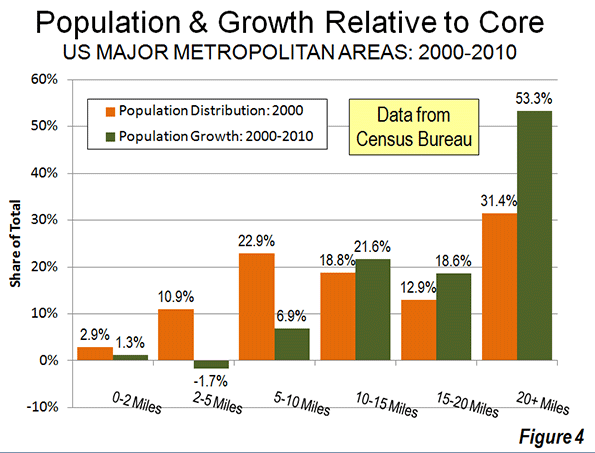
Even when the radius is expanded to 10 miles, the overwhelming majority of growth remains outside. Approximately 94 percent of the aggregate population growth of the major metropolitan areas occurred more than 10 miles from downtown (Figure 2). Figure 3 shows that more than one-half of the growth occurred 20 miles and further from city hall. Further, the population growth beyond 10 miles (10-15 mile radius, 15-20 miles radius and 20 mile and greater radius) from the core exceeded the (2000) share of population, showing the continuing dispersal of American metropolitan areas (Figure 4).
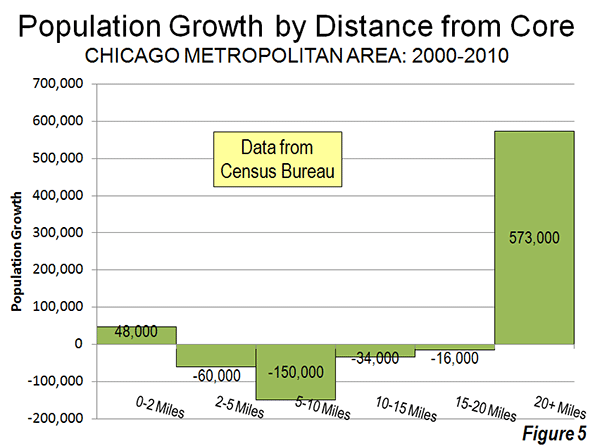
Chicago: The Champion? The Census Bureau press release highlights the fact that downtown Chicago experienced the largest gain in the nation. Downtown Chicago accounted for 13 percent of the metropolitan area's growth with an impressive 48,000 new residents. However, while downtown Chicago was prospering, people were flocking away from the rest of the city. Within a five mile radius of the Loop, there was a net population loss of 12,000 and a net loss of more than 200,000 within 20 miles (Figure 5). Only within the 36th mile radius from city hall is there a net population gain.
Cleveland: Comeback City and Always Will Be? In view of Cleveland’s demographic decline (down from 915,000 in 1950 to 397,000 in 2010), any progress in downtown Cleveland is welcome. But despite the frequently recurring reports, downtown Cleveland's population growth was barely 3,000. Despite this gain, the loss within a 6 mile radius was 70,000 and 125,000 within a 12 mile radius. Beyond the 12- mile radius, there was a population increase of nearly 55,000, which insufficient to avoid a metropolitan area population loss.
Other Metropolitan Areas: A total of 30 major metropolitan areas suffered core population losses, despite the fact that many had downtown population increases.
- Five major metropolitan areas suffered overall population losses (Buffalo, Cleveland, Detroit, Pittsburgh and Katrina ravaged New Orleans).
- St. Louis, with a core city that holds the modern international record for population loss (from 857,000 in 1950 to 319,000 in 2010), experienced a population decline within a 27 mile radius of city hall. Approximately 150 percent of the growth in the St. Louis metropolitan area was outside the 27 mile radius. Even so, there was an increase of nearly 6,000 in the population of downtown St. Louis.
- There were population losses all the way out to a considerable distance from city halls in Memphis (16 mile radius), Cincinnati (15 mile radius) and Birmingham (14 mile radius). The three corresponding downtown areas also lost population.
- Despite having one of the strongest downtown population increases (12,000), population declined within a 10 mile radius of the Dallas city hall. This contrasts with nearby Houston, which also experienced a strong downtown increase (10,000) but no losses at any radius of the urban core.
- Milwaukee experienced a small downtown population increase (2,000), but had a population loss within an11 mile radius.
The other 21 major metropolitan areas experienced population gains throughout. Even so, most of the growth (77 percent) was outside the 10 mile radius. San Jose had the most concentrated growth, with only 24 percent outside a 10 miles radius from city hall. All of the other metropolitan areas had 60 percent or more of their growth outside a 10 mile radius from city hall.
As we have observed before, 2000 to 2010 was, unlike the 1970s and other decades, more friendly to the nation's core cities, although less so than the previous decade. Due to the repurposing of old offices and other structures, sometimes aided by subsidies, small downtown slivers may have done better than at any time since before World War II. But the data is clear. Suburban growth was stronger in the 2000s than in the 1990s. The one percent flocked to downtown and the 99 percent flocked to outside downtown.
| Population Loss Radius: Major Metropolitan Areas | ||||
| Miles from City Hall of Historical Core Municipality* | ||||
| Major Metropolitan Areas (Over 1,000,000 Population | Share of Metropolitan Growth | Population Loss Radius (Miles) | ||
| "Outside Downtown" (2- Mile Radius) | Outside 5-Mile Radius | Outside 10-Mile Radius | ||
| MAJOR METROPOLITAN AREAS: TOTAL | 98.7% | 100.4% | 93.5% | 6 |
| Atlanta, GA | 99.6% | 101.1% | 99.9% | 9 |
| Austin, TX | 98.1% | 96.7% | 81.9% | 0 |
| Baltimore, MD | 106.5% | 118.7% | 99.5% | 9 |
| Birmingham, AL | 104.2% | 132.5% | 124.9% | 14 |
| Boston, MA-NH | 90.8% | 76.9% | 67.3% | 0 |
| Buffalo, NY | Entire Metropolitan Area Loss | |||
| Charlotte, NC-SC | 99.1% | 97.4% | 75.0% | 3 |
| Chicago, IL-IN-WI | 86.7% | 103.3% | 144.6% | 35 |
| Cincinnati, OH-KY-IN | 105.1% | 126.8% | 135.2% | 15 |
| Cleveland, OH | Entire Metropolitan Area Loss | |||
| Columbus, OH | 100.5% | 104.3% | 86.9% | 7 |
| Dallas-Fort Worth, TX | 99.0% | 101.0% | 100.7% | 10 |
| Denver, CO | 98.0% | 100.3% | 89.8% | 5 |
| Detroit, MI | Entire Metropolitan Area Loss | |||
| Hartford, CT | 99.2% | 92.7% | 67.2% | 0 |
| Houston, TX | 99.2% | 99.5% | 98.0% | 0 |
| Indianapolis. IN | 102.1% | 112.1% | 89.6% | 8 |
| Jacksonville, FL | 100.2% | 106.3% | 85.3% | 8 |
| Kansas City, MO-KS | 99.5% | 109.0% | 113.3% | 12 |
| Las Vegas, NV | 101.4% | 98.0% | 63.6% | 4 |
| Los Angeles, CA | 97.3% | 102.2% | 97.6% | 8 |
| Louisville, KY-IN | 102.5% | 108.5% | 90.9% | 8 |
| Memphis, TN-MS-AR | 101.2% | 118.5% | 143.5% | 16 |
| Miami, FL | 99.4% | 93.0% | 91.3% | 0 |
| Milwaukee,WI | 95.9% | 109.0% | 107.5% | 11 |
| Minneapolis-St. Paul, MN-WI | 97.4% | 99.2% | 100.1% | 7 |
| Nashville, TN | 100.0% | 101.4% | 92.4% | 7 |
| New Orleans. LA | Entire Metropolitan Area Loss | |||
| New York, NY-NJ-PA | 93.5% | 81.7% | 68.9% | 0 |
| Oklahoma City, OK | 100.1% | 96.8% | 83.5% | 2 |
| Orlando, FL | 99.7% | 99.4% | 84.2% | 0 |
| Philadelphia, PA-NJ-DE-MD | 92.6% | 98.8% | 96.3% | 7 |
| Phoenix, AZ | 100.7% | 101.8% | 93.6% | 6 |
| Pittsburgh, PA | Entire Metropolitan Area Loss | |||
| Portland, OR-WA | 95.0% | 91.5% | 62.7% | 0 |
| Providence, RI-MA | 96.2% | 91.7% | 70.1% | 0 |
| Raleigh, NC | 99.6% | 93.0% | 67.7% | 0 |
| Richmond, VA | 95.7% | 91.7% | 70.2% | 0 |
| Riverside-San Bernardino, CA | 99.5% | 97.2% | 85.8% | 0 |
| Rochester, NY | 146.9% | 149.3% | 82.5% | 9 |
| Sacramento, CA | 99.9% | 94.4% | 79.5% | 0 |
| Salt Lake City, UT | 98.9% | 95.1% | 84.1% | 0 |
| San Antonio, TX | 101.1% | 102.5% | 86.7% | 7 |
| San Diego, CA | 96.3% | 94.1% | 90.1% | 0 |
| San Francisco-Oakland, CA | 90.7% | 87.6% | 82.2% | 0 |
| San Jose, CA | 95.1% | 79.1% | 24.3% | 0 |
| Seattle, WA | 96.5% | 91.9% | 81.4% | 0 |
| St. Louis,, MO-IL | 94.8% | 119.7% | 148.9% | 27 |
| Tampa-St. Petersburg, FL | 98.6% | 97.8% | 83.7% | 0 |
| Virginia Beach-Norfolk, VA-NC | 93.1% | 90.1% | 82.3% | 0 |
| Washington, DC-VA-MD-WV | 97.5% | 94.5% | 87.9% | 0 |
| Calculated from Census Bureau data | ||||
| *Except in Virginia Beach-Norfolk, Where Virginia Beach is used | ||||
-------
Notes:
Population Weighted Density: In its report, the Census Bureau uses "population-weighted density," rather than average population density to compare metropolitan areas. The Census Bureau justified this use as follows:
"Overall densities of CBSAs can be heavily affected by the size of the geographic units for which they are calculated. Metropolitan and micropolitan statistical areas are delimited using counties as their basic building blocks, and counties vary greatly across the country in terms of their geographic size. With this in mind, one way of measuring actual residential density is to examine the ratio of population to land area at the scale of the census tract, which—of all the geographic units for which decennial census data are tabulated—is typically the closest in scale to urban and suburban neighborhoods".
The Census Bureau rightly points out the problem with comparing metropolitan area density. However, it is a problem of the federal government's making, by virtue of using metropolitan area building blocks (counties) that are sometimes too large for designation of genuine metropolitan areas. These difficulties have been overcome by the national census authorities in Japan in Canada, for example, where smaller building blocks are used (such as municipalities or local government authorities).
Further, the Census Bureau already has a means for measuring population density at the census tract level, which is "the closest in scale to urban and suburban neighborhoods." This is the urban area.
"Population-weighted density" is an interesting concept that can provide an impression of the density that is perceived by the average resident of the metropolitan area. Unfortunately, in its report, the Census Bureau is less than precise with its terminology and repeatedly fails to modify the term density with the important "population-weighted" qualification. This could lead to considerable misunderstanding.
The Census Bureau did not provide average population densities based for the mileage radii. Because of large bodies of water (such as Lake Michigan in Chicago can reduce land areas, it was not possible to estimate population densities by radius.
Census Bureau Revision of Incorrect Report: We notified the Census Bureau of errors in its press release and report on September 27. The problems included substitution of San Francisco population data for Salt Lake City as well as metropolitan population in the supporting spreadsheet file. On September 28, the Census Bureau issued a revised press release and report to rectify the errors. Later the erroneous spreadsheet was withdrawn and had not been re-posted as of October 1. We have made corrections to the spreadsheet for this analysis.
Note: Larger "Downtown" Populations in Smaller Metropolitan Areas: Because of the broad 2-mile radius measure used by the Census Bureau, most of the population increase characterized as relating to downtown occurred outside the major metropolitan areas. This is simply because in smaller metropolitan areas, such an area (12.6 square miles) will necessarily contain a larger share of the metropolitan area. Further, many smaller metropolitan areas are virtually all suburban and had experienced little or no core population losses over the decades that have been so devastating to many large core municipalities. On average, 2.7 percent of the population of major metropolitan areas was within a two-mile radius of city hall in 2010. By comparison, in smaller metropolitan areas, approximately 12.7 percent of the population was within a two mile radius.
Photograph: Chicago Suburbs: (where nearly all the growth occurred), by author


Cities with growing central areas
The contribution Census made to this topic was one of method. Cities are so different, you have to compare apples to apples. Chicago looks good because it is slowly, but successfully growing its central city to the tune of almost 200,000 by now. Some adjacent areas to the north and northwest are also growing, so we are talking maybe 300-400,00 mostly affluent people living in smaller households within four miles of City Hall, Chicago is the new San Franciso, without the very great wealth. As for New York, it is so dense for so far out, it really doesn't compare to any other American city. It is our one world class city. Yes the poorer areas of Chicago are in decline, but so when did any new group that migrated to the big cities stay after one or two generations? Maybe the Chinese, who know how to build compact communities in big cities and make a living off of visiters. Chicago's China town has doubled in size and kept on growing two miles from the Loop. Building a central city in America is a major achievement and requires the kind of civic boosterism that Chicago has always had. It can be done.
population growth is not the
population growth is not the same thing as demand. more people simply moved to where housing was cheap and abundant while the core city gentrified and became more expensive - which usually means less people living in individual dwelling units. What would be a far more useful metric of "growth" would be to look at actual numbers of housing units within a certain radius of the downtown core and corresponding occupancy rates between the two periods rather than just looking at simple population counts. Throwing around a term like "flocked" makes it seem like people willingly chose to move to certain places (and saying the core city "declined" makes it seem like people moved out leaving vacant lots and blight) - but the reality is that people are being priced out of certain neighborhoods and FORCED to move further out - which you sort of allude to in the final paragraph - which is very different from what was happening in the 60s, 70s, and 80s - when all demographics were leaving the city.
This whole analysis just feeds into the dated stereotype the city is in decline and people prefer to live in the suburbs.
city vs. suburb
The reality doobie, is that most buyers are still choosing the suburbs over the city. The reality is that a city like Chicago is still in population decline. Over 200,000 people left, in spite of a fixed up downtown. The middle class and those with families are not choosing and will not be choosing to live in Chicago anytime soon. Huge areas on the south and west sides are virtually vacant, of anyone.
Why? Schools. As soon as you have school aged kids, the city schools just aren't going to cut it for most. Not everybody can get into magnet schools either. Plus in the suburbs you can often get a brand new house too.
Until cities wake up and fix what middle class people want and need, they aren't going to move in. In fact cities cater to the poor more then they do anyone else.
Cities are great for the wealthy because they can buy their way out of problems of the city. The middle class doesn't really care that the orchestra has enough money, they rarely go and its not that far to drive in. They do care that the schools don't suck, the garbage gets picked up and potholes are fixed. Chicago sucks at all of those things.
And to be honest even if Chicago and other major cities could actually fix their problems, they are only going to get a few of those families. Most families will still choose the new house with the big yard over a old house on a tiny lot.
Are safe schools ever found in downtowns?
Are safe schools ever found in downtown environments? The densification approach of "smart" growth makes things worse for kids who are downtown. Elevated air pollution levels contribute to asthma and ADD. Lower test scores result with lower rates of home ownership.
We should be a prosperous nation, and single family homes in the suburbs have been our nation's success from after WWII until the foreclosure crisis. Since the suburbs have had virtually no negative effects other than air pollution, then we should be expanding our suburbs, and moving office parks and entertainment venues to the suburbs.
College branch campuses should be in far distant suburbs, such as the new University of New Mexico branch campus in Rio Rancho, NM (next to the new community college).
Of course, as shown by these census numbers, decentralizion is already happening in cities operating with the free market, such as Rio Rancho, as these markets do not have UGB's or annualized caps on population growth. However, I do not have much hope for areas such as the greater Sacramento area in California, where surrounding areas in the Sierra Foothills have urban growth boundaries, with very expensive housing.
"Since the suburbs have had
"Since the suburbs have had virtually no negative effects other than air pollution, then we should be expanding our suburbs, and moving office parks and entertainment venues to the suburbs."
LOL - wait - you're serious? how old are you people? I feel like I took a wrong turn on the internet and landed in the 1980s.
Gen X.
Me? Gen X. Born and raised in the suburbs. Went to college while living in the suburbs. I still live in the suburbs. Why would I want to live in a "smart growth" downtown with crime, drugs, and other illegal activities? Most young couples prefer to live in the suburbs, for safe neighborhoods and safe schools. Smart growth is not selling in the various markets described in the census data, due to consumer demands for safe suburbs. I would love to live in a small college town with no traffic, however, these towns are just as bad as large downtown areas, as they're notorious for exclusionary zoning, adoption of smart growth policies, unaffordable housing, and having no jobs. Too bad that they don't have the economic vision to attract entrepreneurial talent from the suburbs of large metropolitan areas.
Portland and Willamette Valley Leapfrog Commutes and the BLM
Why is St. Louis the highest, at 148%, for 10 miles?
A few general observations on how this results, in part, from UGB's, although there are multiple factors behind these numbers. I'll write about the places where I've traveled, below, and offer my view on why it's critical to auction BLM lands for development. I believe that a Romney administration will auction BLM lands to developers.
Very interesting that Portland is one of the lowest for outside the 10 mile radius, at only 62.7%. This is a result of the regional urban growth boundary (enforced by METRO), and strict DLCD restrictions on developing farmland in Oregon's Willamette Valley.
Consequentially, many commute from less expensive housing in cities in the Willamette Valley, such as Salem, and even as far away as the bucolic college town of Corvallis, and neighboring Albany. Leapfrog commuting from these (and other) cities, along with high densities due to mandatory high density "smart" growth planning, contributes to excess VMT's, high air pollution, especially during winter inversions. Of course, this system of UGB's defeats the original purpose of "smart" growth, due to long commutes on I-5, which is gridlock during commute hours between Albany and Portland.
Compare Portland to 100% in Dallas, Texas (not Dallas, Oregon), where there is no UGB. Denver is 89%, and has an UGB administered by DRCOG, but Denver has fast growing suburban satellite communities that may, or may not, be included in this census data (such as Boulder, Longmont, Fort Collins, and Castle Rock, although Ft. Collins is outside of DRCOG, yet Ft. Collins has begun buying agricultural land, just like Boulder has done for decades).
The Bay Area (San Francisco) has voter approved UGB's in some cities, such as San Jose (where it's only 24% at 10 miles).
Also, Las Vegas is very low, at only 63%, despite unlimited desert rangeland owned by the BLM and the City of Boulder City, as discussed in Wendell Cox's rental car report on Las Vegas - http://www.rentalcartours.net/rac-lv.pdf
This report on how auctioned Las Vegas BLM land reached $300,000 an acre, at the height of the housing bubble, is a must read for anyone trying to understand why the Southwest crashed. Clearly, we must auction more BLM land around all of the Western US cities that crashed, in order to stimulate all types of construction. Vegas, Reno, and Bend are all surrounded by BLM lands. (Reno and Bend also are surrounded by USFS land that should be preserved for parks. However, BLM owned run down rangeland consisting of cheatgrass, juniper, creosote bush or sagebrush should be developed.)
Riverside and San Bernadino Counties in California have some BLM ownership. California officials have turned large areas of BLM land near Yucca Valley and Palm Springs into nature preserves. Phoenix is surrounded by State Trust lands and some USFS land. Some of this land should be parks, and some of it should be auctioned. However, the "tourism" value of desert rangeland near Phoenix or Palm Springs is questionable, compared to a market with athletes, such as Bend, Ft. Collins, or Boulder.
Phoenix is way too big, anyway, yet the stubborn old timers and groups such as Friends of Flagstaff's Future, who run the Northern Arizona towns of Flagstaff and Sedona, won't let these towns grow. And, there are three UGB's around Flagstaff and its various Coconino County satellite communities.
In contrast, Flagstaff's twin city of Bend, Oregon wants to grow, and demographically, can now finally be considered a "miniature version of Portland." However, in Bend's case, it is the State of Oregon DLCD, along with 1,000 Friends (COLW), who won't let Bend grow, perhaps because they don't like The City's business friendly atmosphere. However, DLCD seems to allow Democrat controlled cities in the Willamette Valley to do whatever they want to.
In contrast, Salt Lake City (84% at 10 miles), Albuquerque, Rio Rancho (NM), and Santa Fe (NM), can continue to expand on private lands, therefore, these markets did not crash, and are still affordable with low unemployment. However, Rio Rancho and Albuquerque imposed impact fees, causing modest price escalation in the mid-2000's. In the past decade, Rio Rancho has grown twice as fast as Albuquerque, in terms of single family housing. (Look at the Benchmark Road Atlases for every state for land ownership, benchmarkmaps.com, a great way to understand land ownership / land use reports from Wendell Cox and Randall O'Toole ...)
Again, disclaimer, the census numbers at 10 miles+ have many more causes besides UGB's and land ownership. Others will post many other reasons. I find the numbers at or exceeding 100% absolutely fascinating, since they indicate where the free market is at work, with people choosing where they want to live, and how far people actually are willing to drive to work. Therefore, Wendell Cox has prepared a report demonstrating, from a spatial perspective, how the free market truly works in land use, but also in real estate development.
Of course, "developers" already know that people will drive 10-30 miles from the "suburbs," and when given the chance in a free market environment, that's where they will build great master planned communities. Yet when the fringe of developable land is within this zone, such as in San Jose and Portland due to urban growth boundaries, then leapfrog commuting leads to unnecessary harm and suffering for working families, with excess fuel consumption, long commutes, and less time at the gym and with family and friends. Unfortunately, our City Planners and City Councilors refuse to listen to both the developers, and also the genuine and unbiased experts on real estate development, such as Wendell Cox.
St. Louis 10+-mile growth
I haven't looked at the data in a while, but if memory serves, St. Louis City (independent) experienced a small loss in population, St. Louis County was more or less flat or lost a small percentage, and St. Charles county experienced a boom. Added all together, it reflects a population outflow.
I think that looking at trends based on the two data points of 2000 and 2010 census is not likely to be very enlightening. There wasn't much of anything going on in St. Louis specifically in 2008-2010... and I just don't know what has been going on since then (I lost my inside track on permit filings). Before that, there was a big push for "drive till you qualify."
Yes, a lot of the outflow is driven by school considerations. People, even people who want to live in the City, don't because of the state of the schools. The inner-ring suburbs with good school districts are relatively pricey for the region (still a fairly low cost of living) and so people move farther out to buy an affordable house in a good school district.
There is also a lot of residual fear of the "The City" by people who were born and raised in St. Louis County and St. Charles County leftover from the 1970s and 1980s. The independent status of the The City doesn't help either with counteracting crime (resources) or with the perception because the denominator for the statistics is artificially small.
UGB
Ah, Urban Growth Boundries. When the "solution" is far worse then any of the supposed problems of a larger developed land area.
Nice Small Towns with Growth Restrictions That Could Expand
In my view, there are many urban growth boundaries in areas that can expand, such as:
1. Bend, Oregon's UGB ... If you widened US-97 between I-84 and Bend, then perhaps at least 500,000 to 700,000 persons could live in Deschusets County (currently, it's about 150,000).
2. Auburn and Placerville, California ... in the Sacramento metro ... and also other Sierra Foothill areas ... These areas are growing rapidly, but some areas have growth controls, and could accommodate hundreds of thousands of persons if not for urban growth boundaries ...
3. Reno-Carson City-Sparks, Nevada ... About 500,000 persons today, but this could easily triple. However, voters in Washoe County voted to cap growth at about 2% a year in 2008, when an environmental group claimed that the region would run out of water. I doubt that's the case, given that Las Vegas plans to pipe water from northeast Nevada. Reno could also do this.
Just a few "small town" examples that can grow ... These are all nice places with a high quality of life (except downtown Reno!). Seems silly to concentrate so many people into "polluted suburbs" around Phoenix and L.A. Fortunately emissions and pollution are less than 30 years ago.
North Dakota is a textbook example of how construction and population growth SHOULD be occurring in our country - along with low unemployment - due to oil and gas. However, such is not the case in Oregon, where the Gilchrist Mill south of Bend, has to import logs from hundreds of miles away. See comment about this from Tom Greene running for Deschusets Co. Commissioner (Oregon) -
http://electtomgreene.squarespace.com/weekly-message-from-tom/2012/9/13/...