
An analysis of the just-released municipal population trends shows that core city growth is centered in the municipalities that have the largest percentage of their population living in suburban (or exurban) neighborhoods.
Improved Urban Core Analysis
There is considerable interest in urban core population trends, both because of recent increases in the interest of urban planning orthodoxy to restore living patterns more akin to the pre-World War II era. At that time, urban areas were considerably more densely populated, commuting travel was much more focused on downtowns (central business districts or CBDs) and automobile use accounted for far less of urban travel than today.
Most previous analysis has equated historical core municipality (core city) data with the urban core. The core cities are generally the original settlements, as they have evolved by expanding their city limits. Around these core cities, suburbs and exurbs have developed, which combined with the core cities make up the metropolitan area. Metropolitan areas are the "economic" dimension of contemporary cities.
However, even the most cursory analysis demonstrates that equating core cities with the urban core is far from ideal. Historical core municipalities vary greatly in their percent of their population living in traditional high density neighborhoods. For example, in core cities like New York, Boston and San Francisco, nearly all people live in neighborhoods that can be classified as urban core. In others of the largest core cities, virtually all of the population lives in neighborhoods that are suburban or exurban, in view of their low densities and overwhelming automobile orientation. These include examples like San Antonio, Phoenix and San Jose. Even core cities perceived to have a strong urban core, such as Portland and Miami, have considerably less than 50% of their population in urban core neighborhoods.
Overall, historical core municipalities have little more than 40% of their population living in urban core neighborhoods. When non-core principal cities or primary cities are equated with core cities, there is even less association with the urban core. Overall, non-core principal cities have less than 10% of their population living in urban core neighborhoods.
This has changed in recent years, with the introduction of the annual American Community Survey and its small area data, such as for ZIP Code analysis zones (ZCTAs). Even so, the comprehensive publication of small area data tends to lag approximately three years behind population estimates. Thus, the small area data that would make it possible to compare population trends to 2014 by functional urban sector within core cities will not be released until 2017.
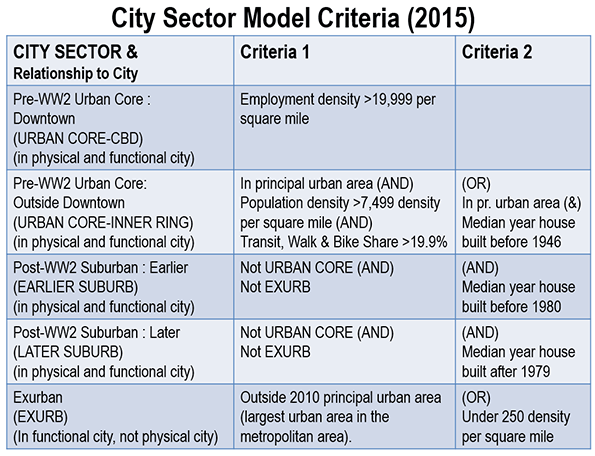
This article classifies 2010 to 2014 core city population growth by the percentage of urban core population according to the 2010 census. The classification was developed using my City Sector Model, which classifies every zip code in metropolitan areas as pre-War urban core (CBD and inner ring) or post-War suburban or exurban (Figure 1). Simplified, the City Sector Model classifies as urban core any small area with an employment density of 20,000 per square mile or more or a population density of 7,500 per square mile or more, with a transit, cycling and walking work trip market share of 20% or more (Note).
Growth by Extent of Urban Core Population
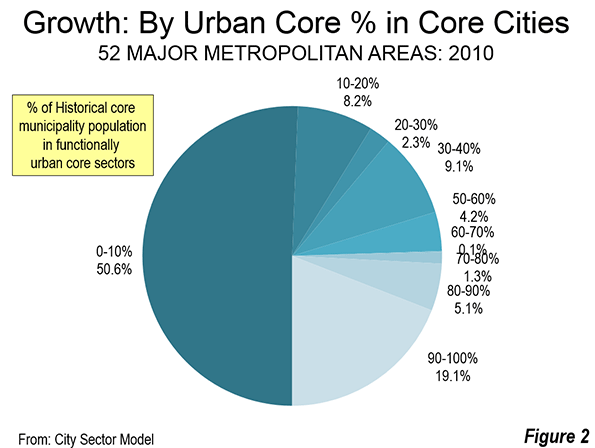
More than 50% of the growth between 2010 and 2014 has been in core municipalities that are more than 90% post World War II suburban or exurban (0 to 10% urban core). This growth share is nearly one-half higher than their population share of 35%.
These findings are based on the City Sector Model (Figure 1 and Note), which classifies small areas (zip code tabulation areas) principally using population density and commuting market share data that attempts to replicate urban areas as they functioned before World War II.
These most suburban of core cities grew the fastest, up 6.8% from 2010 to 2014. These municipalities had less than 10% of their population in urban core neighborhods, and include core cities that annexed substantial suburban or rural territory, such as Phoenix, San Jose, Charlotte, Tampa, Orlando and San Antonio. Those that were most heavily urban core in form grew 4,0 percent, which was slightly behind the national average of 4.7 percent. The core cities had less than 10% of their population living in urban core neighborhoods, and include New York, Buffalo, Providence, San Francisco and Boston (Figure 2)
The functionally suburban and exurban areas accounted for approximately 58% of the population in the core cities. This leaves approximately 42% of the population living in areas that are similar to the urban areas as they functioned in 1940.
Approximately 70% of the growth was in the 33 historical core municipalities that are more than 60% suburban or exurban.
At the same time, the five core cities with the largest urban core percentages accounted for nearly 20% of the growth, compared to their 22 percent of the population. Approximately 80% of this growth was in New York, which is estimated to have added the largest population (316,000) among the core cities.
Ten Fastest Growing Core Municipalities
Six of the ten fastest growing core cities had urban core shares of less than 10%, including Austin, Orlando, Charlotte, Raleigh, Atlanta and San Antonio. A seventh, Denver was less than 15% urban by function. Two more had more than 50% in urban core population, Washington and Seattle (Table). Eight of the 10 fastest growing core cities were in the South, including Washington.
| Table | |||||||
| Population Growth: 2010-2014 | |||||||
| Core Municipalities in Major Metropolitan Areas | |||||||
| Population | Population in Pre-War Functional Urban Core | ||||||
| Rank | Historical Core Municipality | Metropolitan Area | 2010 | 2014 | % Change | Historical Core Municipality | Metropolitan Area |
| 1 | Austin | Austin, TX | 790,637 | 912,791 | 15.5% | 4.8% | 2.2% |
| 2 | New Orleans | New Orleans. LA | 343,829 | 384,320 | 11.8% | 37.9% | 10.9% |
| 3 | Denver | Denver, CO | 600,024 | 663,862 | 10.6% | 13.1% | 3.1% |
| 4 | Orlando | Orlando, FL | 238,304 | 262,372 | 10.1% | 0.0% | 0.0% |
| 5 | Charlotte | Charlotte, NC-SC | 735,780 | 809,958 | 10.1% | 0.0% | 0.0% |
| 6 | Seattle | Seattle, WA | 608,660 | 668,342 | 9.8% | 52.6% | 10.5% |
| 7 | Washington | Washington, DC-VA-MD-WV | 601,723 | 658,893 | 9.5% | 83.7% | 16.5% |
| 8 | Raleigh | Raleigh, NC | 403,947 | 439,896 | 8.9% | 0.0% | 0.0% |
| 9 | Atlanta | Atlanta, GA | 420,279 | 456,002 | 8.5% | 9.2% | 0.7% |
| 10 | San Antonio | San Antonio, TX | 1,327,605 | 1,436,697 | 8.2% | 0.1% | 0.1% |
| 11 | Miami | Miami, FL | 399,508 | 430,332 | 7.7% | 23.0% | 3.0% |
| 12 | Oklahoma City | Oklahoma City, OK | 580,003 | 620,602 | 7.0% | 6.1% | 2.8% |
| 13 | Dallas | Dallas-Fort Worth, TX | 1,197,833 | 1,281,047 | 6.9% | 1.1% | 0.5% |
| 14 | Tampa | Tampa-St. Petersburg, FL | 335,709 | 358,699 | 6.8% | 0.0% | 0.0% |
| 15 | Houston | Houston, TX | 2,097,217 | 2,239,558 | 6.8% | 1.4% | 0.5% |
| 16 | Nashville | Nashville, TN | 603,527 | 644,014 | 6.7% | 0.7% | 0.2% |
| 17 | Richmond | Richmond, VA | 204,237 | 217,853 | 6.7% | 26.0% | 4.5% |
| 18 | San Jose | San Jose, CA | 952,562 | 1,015,785 | 6.6% | 0.1% | 0.2% |
| 19 | Minneapolis | Minneapolis-St. Paul, MN-WI | 382,578 | 407,207 | 6.4% | 86.0% | 0.0% |
| 20 | Boston | Boston, MA-NH | 617,594 | 655,884 | 6.2% | 90.4% | 35.5% |
| 21 | Phoenix | Phoenix, AZ | 1,447,552 | 1,537,058 | 6.2% | 0.0% | 0.0% |
| 22 | San Diego | San Diego, CA | 1,301,621 | 1,381,069 | 6.1% | 2.8% | 1.2% |
| 23 | Portland | Portland, OR-WA | 583,778 | 619,360 | 6.1% | 37.9% | 10.0% |
| 24 | Columbus | Columbus, OH | 788,577 | 835,957 | 6.0% | 12.0% | 5.0% |
| 25 | Oakland | San Francisco-Oakland, CA | 390,719 | 413,775 | 5.9% | 54.7% | 0.0% |
| 26 | San Francisco | San Francisco-Oakland, CA | 805,235 | 852,469 | 5.9% | 94.4% | 0.0% |
| 27 | Las Vegas | Las Vegas, NV | 583,787 | 613,599 | 5.1% | 7.8% | 2.8% |
| 28 | Stl Paul | Minneapolis-St. Paul, MN-WI | 285,068 | 297,640 | 4.4% | 38.7% | 0.0% |
| 29 | Sacramento | Sacramento, CA | 466,488 | 485,199 | 4.0% | 7.6% | 1.6% |
| 30 | New York | New York, NY-NJ-PA | 8,175,136 | 8,491,079 | 3.9% | 97.3% | 52.8% |
| 31 | Jacksonville | Jacksonville, FL | 821,784 | 853,382 | 3.8% | 0.0% | 0.0% |
| 32 | Los Angeles | Los Angeles, CA | 3,792,627 | 3,928,864 | 3.6% | 30.1% | 10.6% |
| 33 | Indianapolis | Indianapolis. IN | 820,442 | 848,788 | 3.5% | 11.0% | 4.8% |
| 34 | Grand Rapids | Grand Rapids, MI | 188,040 | 193,792 | 3.1% | 19.1% | 3.8% |
| 35 | Louisville | Louisville, KY-IN | 597,336 | 612,780 | 2.6% | 17.8% | 8.7% |
| 36 | San Bernardino | Riverside-San Bernardino, CA | 209,952 | 215,213 | 2.5% | 0.0% | 0.0% |
| 37 | Kansas City | Kansas City, MO-KS | 459,787 | 470,800 | 2.4% | 19.8% | 5.4% |
| 38 | Salt Lake City | Salt Lake City, UT | 186,443 | 190,884 | 2.4% | 21.4% | 3.7% |
| 39 | Philadelphia | Philadelphia, PA-NJ-DE-MD | 1,526,006 | 1,560,297 | 2.2% | 86.1% | 25.8% |
| 40 | Memphis | Memphis, TN-MS-AR | 646,889 | 656,861 | 1.5% | 3.7% | 1.8% |
| 41 | Norfolk | Virginia Beach-Norfolk, VA-NC | 242,803 | 245,428 | 1.1% | 2.8% | 0.4% |
| 42 | Chicago | Chicago, IL-IN-WI | 2,695,598 | 2,722,389 | 1.0% | 76.6% | 25.8% |
| 43 | Milwaukee | Milwaukee,WI | 594,740 | 599,642 | 0.8% | 55.4% | 23.6% |
| 44 | Providence | Providence, RI-MA | 178,036 | 179,154 | 0.6% | 92.6% | 26.2% |
| 45 | Cincinnati | Cincinnati, OH-KY-IN | 296,950 | 298,165 | 0.4% | 54.2% | 10.1% |
| 46 | Baltimore | Baltimore, MD | 620,961 | 622,793 | 0.3% | 67.7% | 16.2% |
| 47 | Birmingham | Birmingham, AL | 212,288 | 212,247 | 0.0% | 0.0% | 0.0% |
| 48 | Hartford | Hartford, CT | 124,775 | 124,705 | -0.1% | 88.5% | 11.3% |
| 49 | Pittsburgh | Pittsburgh, PA | 305,702 | 305,412 | -0.1% | 78.0% | 15.9% |
| 50 | Rochester | Rochester, NY | 210,512 | 209,983 | -0.3% | 51.7% | 11.4% |
| 51 | St. Louis | St. Louis,, MO-IL | 319,294 | 317,419 | -0.6% | 84.1% | 11.7% |
| 52 | Buffalo | Buffalo, NY | 261,310 | 258,703 | -1.0% | 96.0% | 29.2% |
| 53 | Cleveland | Cleveland, OH | 396,814 | 389,521 | -1.8% | 80.1% | 22.2% |
| 54 | Detroit | Detroit, MI | 713,777 | 680,250 | -4.7% | 32.1% | 6.5% |
| Data from: | |||||||
| US Census Bureau | |||||||
| City Sector Model (2015) | |||||||
Austin has been the fastest growing historical core municipality over the four years. In 2010, Austin had 790,000 residents, and has increased 15.5% to 913,000.
New Orleans was the second fastest growing, adding 11.8%, continuing its recovery from the huge population loss after Hurricanes Katrina and the related flood control failures, which the Independent Levee Investigation Team concluded was the "single most costly catastrophic failure of an engineered system in history." New Orleans has now recovered more than 70% of its population loss between 2005 and 2006. In 2005, the population was 455,000, which fell to 209,000 in 2006, before recovering to the 2014 figure of 384,000.
The balance of the top five, Denver, Orlando and Charlotte also grew more than 10% between 2010 and 2014. The second five in population growth were Seattle, Washington (DC), Raleigh, Atlanta and San Antonio.
Slowest Growing Core Municipalities
Eight of the 10 slowest growing municipalities were in the Northeast and Midwest, including Detroit, Cleveland, Buffalo, St. Louis, Rochester, Pittsburgh, Hartford and Cincinnati. Two were in the South, Birmingham and Baltimore.
Eight core municipalities lost population. The largest loss was in Detroit, which fell 4.7% to 680,000. This is a continuation of the catastrophic losses from 1950, when Detroit had 1,850,000 residents. It may be surprising, however, that Detroit has become the core municipality with the greatest loss only this year. Until 2013, St. Louis had lost the largest share of its population from 1950 (when its population was 857,000). By 2014, Detroit had lost 63.2% of its 1950 population, compared to the 63.0% loss in St. Louis). St. Louis also continued its losses, dropping 0.6% between 2010 and 2014.
Cleveland and Buffalo had greater losses than St. Louis. Cleveland slipped 1.8% to 390,000, while Buffalo dropped 1.0% to 259,000. Losses of less than 0.5% were posted in Pittsburgh, Hartford and Birmingham.
More-than-a-Million Municipalities
The United States added its 10th municipality with more than 1,000,000 in the 2014 estimates. San Jose joins Los Angeles and San Diego as California's third more-than-a-million city. As a result, California now equals Texas, which had led the nation, with three cities with more than 1,000,000 residents in previous years (Houston, San Antonio and Dallas).
Texas, however, should soon reclaim the exclusive title. The city of Austin forecasts that its population will reach 1,000,000 population early in the 2020s, which would give Texas four more-than-a-million municipalities. This forecast, however, could be too conservative. If the Texas city continues to grow at its current rate, a population of more than 1,000,000 could be reached before the 2020 census.
Yet, the core municipalities with more than 1,000,000 – particularly the new entrants – are not particularly dense, but are virtually suburban in form, that is, auto-oriented and generally low density. Three have less than one percent of their population in urban core neighborhoods, including Phoenix, San Antonio and San Jose, Dallas and Houston have less than two percent of their population in urban core neighborhoods, while San Diego has less than three percent. Even in Los Angeles only 30% of residents live in urban core neighborhoods. Only three of the largest municipalities have most of their population in urban core neighborhoods, New York, (97%), Philadelphia (86%) and Chicago (77%).
Lower Density Growth Could be Dominant in Core Cities
The new population estimates provide little indication how much core city growth since 2010 is urban intensification versus low density suburban development. However, the concentration of growth where urban cores are smaller implies that growth has been stronger at lower in the suburban portions of core municipalities. To know for sure will require waiting for later small area data.
Related article: U.S. Population Estimate Accuracy: 2010
Note: The analysis is based on the City Sector Model (Figure 1), which classifies small areas (ZIP codes, more formally, ZIP Code Tabulation Areas, or ZCTAs) in major metropolitan areas based upon their behavioral functions as urban cores, suburbs or exurbs. The criteria used are generally employment and population densities and modes of work trip travel. The purpose of the urban core sectors is to replicate, to the best extent possible, the urban form as it existed before World War II, when urban densities were much higher and when a far larger percentage of urban travel was on transit or by walking. The suburban and exurban sectors replicate automobile oriented suburbanization that began in the 1920s and escalated strongly following World War II.
Wendell Cox is principal of Demographia, an international public policy and demographics firm. He is co-author of the "Demographia International Housing Affordability Survey" and author of "Demographia World Urban Areas" and "War on the Dream: How Anti-Sprawl Policy Threatens the Quality of Life." He was appointed to three terms on the Los Angeles County Transportation Commission, where he served with the leading city and county leadership as the only non-elected member. He served as a visiting professor at the Conservatoire National des Arts et Metiers, a national university in Paris. Wendell Cox is Chair, Housing Affordability and Municipal Policy for the Frontier Centre for Public Policy (Canada), is a Senior Fellow of the Center for Opportunity Urbanism and is a member of the Board of Advisors of the Center for Demographics and Policy at Chapman University.
Photo: Newest more-than-a-million US core city, virtually all-suburban San Jose by Robert Campbell [GFDL or CC BY-SA 3.0], via Wikimedia Commons


