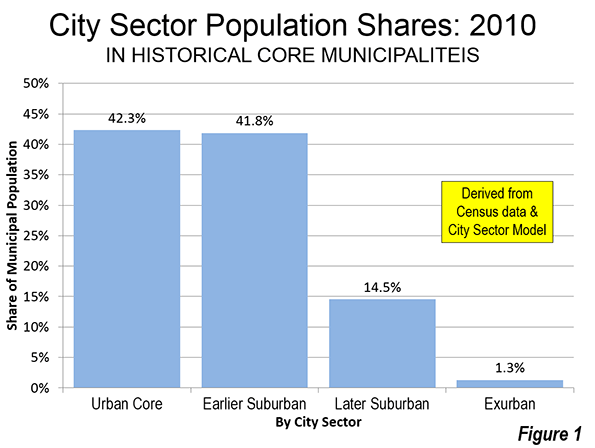
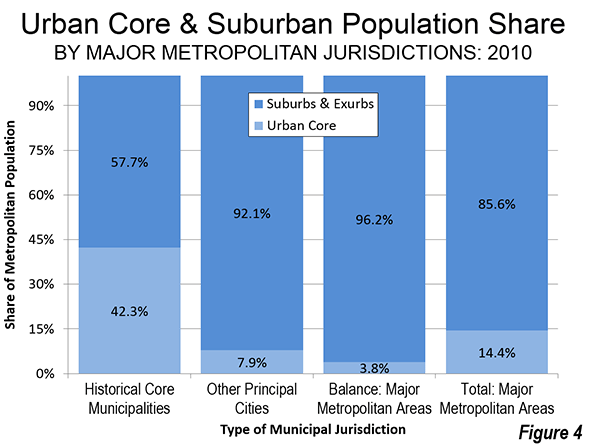
Many American cities, described commonly as urban cores, are functionally more suburban and exurban, based on urban form, density, and travel behavior characteristics. Data from the 2010 census shows that 42.3 percent of the population of the historical core municipalities was functionally urban core (Figure 1). By comparison, 56.3 of the population lived in functional suburbs and another 1.3 percent in functionally exurban areas (generally outside the urban areas). Urban cores are defined as areas that have high population densities (7,500 or per square mile or 2,900 per square kilometer or more) and high transit, walking and cycling work trip market shares (20 percent or more). Urban cores also include non-exurban sectors with median house construction dates of 1945 or before. All of these areas are defined at the zip code tabulation area (ZCTA) level, rather than by municipal jurisdiction. This is described in further detail in the "City Sector Model" note below.
The Varieties of Central Cities
Of course the “urbaneness” of central cities vary greatly. Some, like New York, Boston, Chicago, and San Francisco experienced much of their growth before the 20th century, well before the great automobile oriented suburbanization that occurred after World War II. Others, that experienced early growth, such as Milwaukee and Seattle, annexed substantial areas of suburbanization after World War II, so that their comparatively large functional urban cores have been overwhelmed by suburbs within the city limits. Los Angeles, with a large functional urban core, annexed huge swaths of agricultural land that later became suburban. Finally, a number of other central cities, such as Phoenix and San Jose, have developed since World War II and are virtually all suburban,
Moreover, central cities comprise very different proportions of their respective metropolitan areas (the functional or economic definition of "city"). For example, the central city of San Antonio comprises 62 percent of the San Antonio metropolitan area population. Conversely, the city of Atlanta comprises only 8 percent of the Atlanta metropolitan area population. Obviously, with such a large differential, the term central city describes jurisdictions that are radically different.
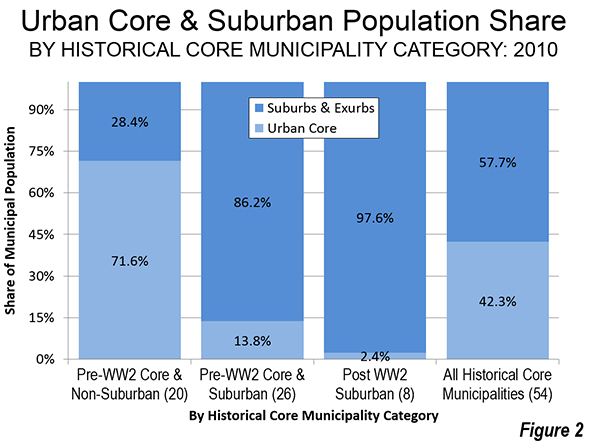
This difference is caught by examining the functional urban cores by historical core municipality classifications. The Pre-World War II Core & Non-Suburban central cities have functional urban cores comprising 72 percent of their population. The Pre-World War II Core & Suburban central cities have functional urban cores that are only 14 percent of their populations. The Post-World War II Suburban central cities have very small urban cores, representing only 2 percent of their population (Figure 2).
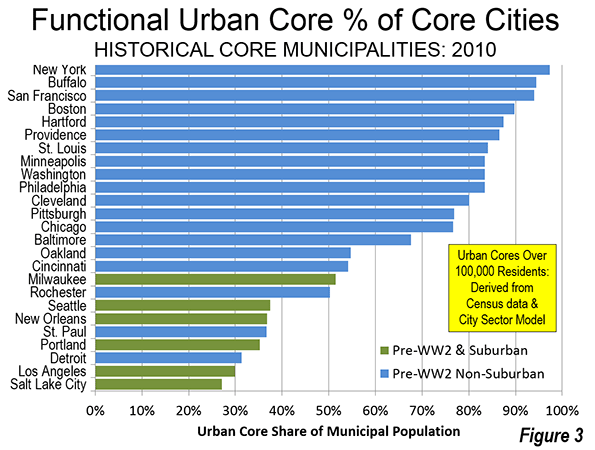
Among the 54 historical core municipalities, the share of central city population in the functional urban cores varies from a high of more than 97 percent (New York) to virtually zero (Birmingham, Charlotte, Dallas, Jacksonville, Orlando, Phoenix, Raleigh, San Bernardino, San Jose, and Tampa).
Core Cities with the Strongest Urban Cores
It is not surprising that the central cities with the largest share of their populations in the functional urban cores are in the older, established are concentrated in the Northeast Corridor (Washington to Boston) and the Midwest. Only one of the 14 central cities with the highest population share in functional urban cores is outside these areas is San Francisco, the first large city to be built on the American West Coast Among the 25 central cities with the highest functional urban core share, only seven are outside the Northeast Corridor or the Midwest (San Francisco, Oakland, Seattle, New Orleans, Portland, Los Angeles and Salt Lake City).
It is not surprising that the city of New York has the largest function urban core population share, at 97.3 percent. Nearly one-third of the total urban core population in the 52 major metropolitan areas lives in the city of New York (nearly 8,000,000 residents).
Two other central cities have functional urban core population percentages above 90 percent. Buffalo ranks second, at 94.5 percent. San Francisco is third at 94.0 percent.
The next three highest ranking cities are in New England. Boston has an 89.7 percent functional urban core population, followed by Hartford (87.4 percent), and Providence (86.5 percent). These are all of the major metropolitan areas in New England.
Three Midwestern central cities have more than 80 percent of their populations in functional urban cores, including St. Louis (84.1 percent), Minneapolis (83.5 percent), and Cleveland (80.1 percent). Washington (83.4 percent) and Philadelphia (83.4 percent), in the Northeast Corridor also have greater than 80 percent functional urban core shares.
Pittsburgh (76.9 percent) and Chicago (76.6 percent) have functional urban core population shares between 70 percent and 80 percent. At 67.7 percent, Baltimore (67.7 percent) is the only central city in the Northeast Corridor that with less than 70 percent of its population in the functional urban core.
Oakland (54.7 percent), at 15th, is the highest ranking central city outside the Northeast Corridor and the Midwest other than San Francisco. Cincinnati, Rochester, and Milwaukee also have more than 50 percent of their population in functional urban cores.
The top 25 is rounded out by Seattle (37.5 percent), New Orleans (36.8 percent), St. Paul (36.7 percent), Portland (35.2 percent), Detroit (31.3 percent), Los Angeles (29.9 percent) and, somewhat unexpectedly, Salt Lake City (27.1 percent).
The central cities with the largest functional urban core percentages have overwhelmingly suffered large population losses. Among the 25 with the largest urban core shares, only seven were at their peak populations at the 2010 census, and only two of the top 18 (New York and San Francisco). Overall the cities with large functional cores lost more than 35 percent of their population and 8 million residents.
"Other" Principal Cities
Starting in 2003, the Office of Management and Budget (OMB) retired the term "central city" and replaced it with "principal city," which includes the 54 former historical core municipalities and approximately 160 additional cities. The adoption of principal city terminology recognized as OMB described it, that metropolitan areas were no longer monocentric, but had become polycentric. OMB specifically rejected the use of geographical terms other than "principal city" within metropolitan areas, including "suburb." Indeed, the very employment of polycentricity that justified abandonment of the central city designation was the suburbanization of employment. Yet some popular usage (even in some Census Bureau documents), considers any area that is not a principal city as suburban. The more appropriate term would be "not principal city."
Some principal cities that are not historical core municipalities ("other" principal cities) have strong urban cores, especially in metropolitan areas where the urban core stretches well beyond the core municipality's city limits, especially in New York and Boston. Four such principal cities have urban cores larger than 100,000 and urban core population shares exceeding 90 percent, including Cambridge in the Boston area (97.0 percent, and the New York area's Newark (94.7 percent) and Jersey City (100.0 percent), which is higher even than New York City itself. None of these cities was at its population peak in 2010.
Even so the vast majority of the "other" principal cities are overwhelmingly suburban, comprising less of the functional urban core population than areas that are not principal cities (1.5 million compared to 4.1 million outside the principal cities). Overall, the other principal cities are 7.9 percent urban core (compared to 42.3 percent for the historical core municipalities). If the 11 municipalities with cores larger than 50,000 are excluded, the share living in functional urban cores for the remaining more than 150 cities is 1.5 percent. (Figure 4).
Crude Measurement
The perhaps stunning conclusion is that the average difference between the historical core municipality population and the functional urban core population is 73 percent. Core cities --- themselves 57 percent suburban and exurban --- are a crude basis for classifying urban cores and suburbs. Principal cities --- 92 percent functionally suburban or exurban --- are even worse. The bottom line: America is fundamentally more suburban in nature than commonly believed.
-----
City Sector Model Note: The City Sector Model allows a more representative functional analysis of urban core, suburban and exurban areas, by the use of smaller areas, rather than municipal boundaries. The nearly 9,000 zip code tabulation areas (ZCTA) of major metropolitan areas are categorized by functional characteristics, including urban form, density and travel behavior. There are four functional classifications, the urban core, earlier suburban areas, later suburban areas and exurban areas. The urban cores have higher densities, older housing and substantially greater reliance on transit, similar to the urban cores that preceded the great automobile oriented suburbanization that followed World War II. Exurban areas are beyond the built up urban areas. The suburban areas constitute the balance of the major metropolitan areas. Earlier suburbs include areas with a median house construction date before 1980. Later suburban areas have later median house construction dates.
-----
Wendell Cox is principal of Demographia, an international public policy and demographics firm. He is co-author of the "Demographia International Housing Affordability Survey" and author of "Demographia World Urban Areas" and "War on the Dream: How Anti-Sprawl Policy Threatens the Quality of Life." He was appointed to three terms on the Los Angeles County Transportation Commission, where he served with the leading city and county leadership as the only non-elected member. He was appointed to the Amtrak Reform Council to fill the unexpired term of Governor Christine Todd Whitman and has served as a visiting professor at the Conservatoire National des Arts et Metiers, a national university in Paris.
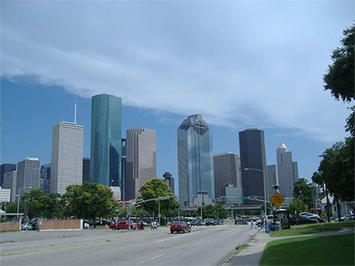
Photo: Downtown Houston (by author)


and the closer you look the more questionable it seems
On top of the other shortcomings of classifications like "principle cities", I have to wonder about the figure for Minneapolis (83.5 percent in functional urban core; I note St. Paul is counted separately).
The 2012 population of Minneapolis was 392,880. This is 33% of the 1,184,576 population (2012) of Hennepin County, which includes Minneapolis and most but not all of its suburbs.
I don't know what the density numbers are for places like Richfield and Brooklyn Center, but everything outside of Minneapolis city limits is single-family housing, with a scattering of apartments (most numerous in the inner-ring suburbs). The population density of Plymouth, a third-ring suburb, almost completely built up, is roughly 1800 per square mile.
Mass transit outside Minneapolis consists almost entirely of routes into and out of central Minneapolis during the rush hours. The Metropolitan Council is decidedly hostile to any other transportation, though they are softening up a bit in anticipation of a backlash in the coming election. (I live in a suburb of Minneapolis, and I certainly couldn't have contemplated this afternoon's shopping trip using mass transit. Mass transit was useless when I worked in Minneapolis, since I often worked after 6:00 p.m.)
Even much of Minneapolis would be called suburban on all counts except mass transit.
You wrote: "Earlier suburbs
You wrote: "Earlier suburbs include areas with a median house construction date before 1980. Later suburban areas have later median house construction dates." Can you direct me to a list of suburban areas with median house construction dates after 1980?
Also, you wrote: "Conversely, the city of Atlanta comprises only 8 percent of the Atlanta metropolitan area population." Do any of the other cities in the Atlanta metropolitan area equal or exceed 8%?*
* I used to be able to look up the answer to questions like that by going to www.world-gazetteer.com . It was a site in the Netherlands run by Stefan Helder. The URL was sold and all the information, built up over a period of 20 years, has disappeared. I made an inquiry about it in an online forum. One reply that I got was that many similar sites are operated as a hobby and that the owner probably no longer had the funds to maintain it. So I'm at a loss now. That site had, for instance, all the metropolitan population figures for areas in India, ranked from highest to lowest. I could click the Calcutta, India metro. area and see the names of cities and their populations ranked from high to low/low to high. It just had too many features to enumerate here. Suffice it to say that it would have given me a list of all the towns and cities [rather, "principal cities" :)] in the Atlanta metro area, ranked by population.
Steve C.
Response
Steve...
Thank you for the inquiry. Median house construction dates in the US are available for just about any geography from the American Community Survey. It is not the easiest system to use, but once you learn it you can get whatever you want..
http://factfinder2.census.gov/faces/nav/jsf/pages/searchresults.xhtml?re...
Atlanta is the largest municipality in the Atlanta metropolitan area.
Best regards,
Wendell Cox
Demographia
www.demographia.com