
Going into the silly-season of US Presidential campaigning, I want to get a head start on updating the “Are you better off today than you were four years ago?” discussion. In an April 2009 ng article, Rogue Treasury, I compared measures of our economic well-being before and after passage of the Emergency Economic Stabilization Act of 2008. Treasury assured Congress and the people that spending $700 billion would “ensure the economic well-being of Americans.” The Troubled Asset Relief Program (TARP) was going to save the American Dream of homeownership. The numbers showed a very different story. We were, in fact, largely worse off in the first six months after the bill passed. In the table below, I update the figures for May 2015.
|
|
Before TARP |
So Far |
2015 Update |
|
National Unemployment |
7% |
8% |
5.5% |
|
Lowest state unemployment |
3.3% (WY) |
3.9% (WY) |
2.6% (NE) |
|
Highest state unemployment |
9.3% (MI) |
12% (MI) |
7.6% (CO) |
|
National Foreclosure rate (per 5,000 homes) |
11 |
11 |
5 |
|
Lowest state foreclosure rate |
< 1 in 7 states |
< 1 in 6 states |
<1 in 4 states |
|
Highest state foreclosure rate |
68 (NV) |
71 (NV) |
12 (FL) |
|
Dow Jones Industrial Average |
10,325 |
7,762 |
18,126 |
“Before TARP” figures are as close to passage of the Bailout Bill (October 3, 2008) as possible; “So Far” figures vary slightly by category from February through April 2009. Unemployment and foreclosure rates by state were available at Stateline.org. The 2015 Update are May 2015 from RealtyTrac.com and BLS.gov.
“Before TARP” figures are as close to passage of the Bailout Bill (October 3, 2008) as possible; “So Far” figures vary slightly by category from February through April 2009. Unemployment and foreclosure rates by state were available at Stateline.org. The 2015 Update are May 2015 from RealtyTrac.com and BLS.gov.
Six years later, homeowners appear to be potentially better off even in the worst hit state, Nevada, where they can no longer claim the highest state foreclosure rate. That honor now belongs to Florida. But look at the other end – there are fewer states than ever in the category of having less than 1 foreclosure per 5,000 homes. In December 2006, there were 17 states with less than 1 per 5,000 homes. Nationally, foreclosures in May 2015 were about where they were in December 2006, before things got really bad but after foreclosures were already on the rise nationally – up 35% from the previous year. In December 2006, Florida was at about 6 foreclosures per 5,000 homes; the rate is double that now at 12. Nevada was at 13 in 2006 compared to about 10 now.
National unemployment before the recession and all the bailouts and stimulus packages (2007 average) was 4.6% – we just are not seeing full recovery yet. Nebraska’s unemployment rate is a little lower now than the 2007 annual average of 3.0%. At the other end of the spectrum, Colorado’s May 2015 unemployment rate is 7.6%, still about double its rate of 3.8% from 2007. Where there is recovery, it is very, very uneven. The battle ground states in the 2012 Presidential election were Colorado (worse), Florida (worse), Michigan (better), and Nevada (better).
Meanwhile, the rich got richer with TARP. The Dow Jones Industrial Average is up 75% above its pre-TARP level. This as it turns out, seems to be the point of TARP after all. Instead of helping citizens stay in their homes, TARP was used to bailout the banks by purchasing the mortgage-backed securities that weren’t backed by mortgages. After about a month of that, in November 2008, Quantitative Easing (QE) was used to buy the mortgage-related bonds and the TARP money was re-directed so the Fed could take ownership positions in financial institutions.
By the way, just as we had pointed out in our January 2009 ng article Should We Bailout Geithner Too? a US Court ruled that the New York Fed did not have legal authority to take over a business. On June 15, 2015, Judge Thomas C. Wheeler ruled (in Starr International v. The United States, Case No. 11-779C) wrote: ‘there is nothing in the Federal Reserve Act or in any other federal statute that would permit a Federal Reserve Bank to take over a private corporation and run its business as if the Government were the owner’ the way they did with AIG. Judge Wheeler noted that the Fed’s own lawyers told them they were ‘on thin ice’ going forward with their plans.
Here’s the bottom line: Legislation that was passed to support homeownership ended up supplying cash to banks both domestic and foreign. Between TARP and QE, the banks were able to sell all of their junk bonds to the government and use the extra cash to pad their reserve funds. More than half of the total money supply in the US is sitting in banks as excess reserves, earning 0.25% interest. That’s about $6.3 billion a year going to the banks on top of all the bailouts, loans, junk bond sales, etc. When the Fed decides to raise interest rates – my guess is February 2016 – the banks will be earning even more by holding on to the money they got from the Fed
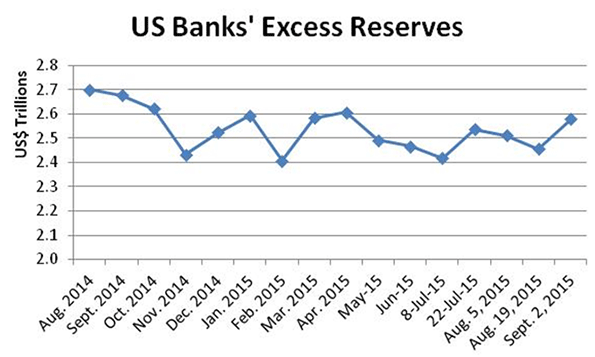
Data Source: http://www.federalreserve.gov/releases/h3/Current/, Table 2. Monthly August 2014 through June 2015, then bi-weekly from July 8 through September 2, 2015.
Banks are using their excess reserves to run up the value of the stock market through overnight lending and investments. These are short-term investments – overnight is very short term! They are not the kinds of investments that create jobs or make homeowners better off. They are, however, the kinds of investments that make bankers better off. They also add to the wild swings you see in the Dow Jones Industrials Average (volatility).
Richard Nixon was quoted by a British newspaper in 1987 as saying that if the economy turns down, “a jackass” could be elected on the Democratic ticket.* As the 1988 presidential election approached, the US had just completed 6 years of economic expansion and the unemployment rate was 5.3%. George H.W. Bush (R) won the White House over Michael Dukakis (D) with 426 electoral votes to 111. In November 2008, the banks got the biggest bailouts in history while the nation and the world were entering the Great Recession. Barack Obama (D) beat out John McCain (R) by 365 to 173. If the banks keep going the way they have been, it could be very good news for some jackass running to extend the Obama economy … and bad news for the rest of us.
*Cited in ‘A New Political Picture’ by Tom Wicker, New York Times, 22 October 1987, p. A35.
Susanne Trimbath, Ph.D. is CEO and Chief Economist of STP Advisory Services. Dr. Trimbath’s credits include appearances on national television and radio programs and the Emmy® Award nominated Bloomberg report Phantom Shares. She appears in four documentaries on the financial crisis, including Stock Shock: the Rise of Sirius XM and Collapse of Wall Street Ethicsand the newly released Wall Street Conspiracy. Dr. Trimbath was formerly Senior Research Economist at the Milken Institute. She served as Senior Advisor on United States Agency for International Development capital markets projects in Russia, Romania and Ukraine. Dr. Trimbath teaches graduate and undergraduate finance and economics.
Wall Street photo by flickr user Manu_H.


