
Indulge me please as I tried to write my first sports column. No, I have no intention of applying for the job of newgeography.com’s sports editor and others have been far more prolific on this issue. I have been falling out of love with sports for decades now.
That does not mean, however, that I ignore the sporting world. I may be withdrawing from spectator sports but I am interested in statistics they produce. Attendance figures have always intrigued me. It is impressive that more than 100,000 fans routinely fill stadiums in Ann Arbor, Columbus, Tuscaloosa, Baton Rouge, College Station, State College, Austin, and Knoxville. Even so the largest crowds no longer occur, such as Notre Dame, Navy and USC, which drew the largest college football crows in history, at Chicago’s Soldier Field when its capacity was 165,000 (capacity source: 1929 World Almanac). Baseball’s record was more than 115,000 at a Los Angeles Coliseum exhibition game in 2008, celebrating 50 years since the Dodgers moved from Brooklyn.
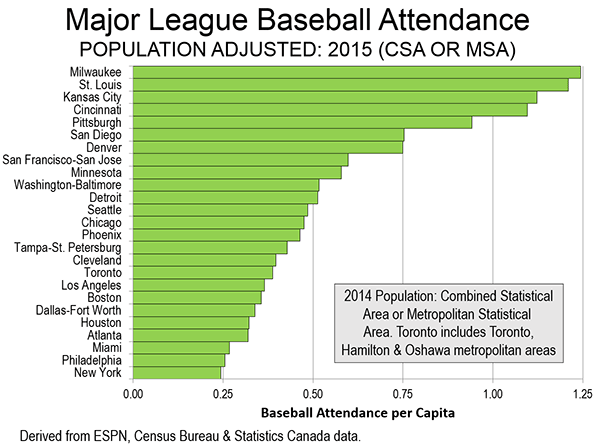
Recently, major league baseball announced its annual attendance figures. Living in St. Louis, a middle-sized market that has usually drawn large market crowds, it struck me that it might be interesting to compare attendance figures to the population in the commuting sheds of the major league markets. By commuting sheds, I mean the combined statistical areas or where they do not exist, the metropolitan statistical areas.
So I did a simple calculation of the major league attendance in each market compared to the population. The attendance data is readily available on the ESPN website for any wanting a more in-depth look. Obviously, the market with the highest annual fans per capita would be the best baseball town. I frankly expected that it would be St. Louis. It was not . The figure below shows the results.
The Top 5
The five best baseball towns are all on inland waters, on the Great Lakes and the other four on the Mississippi River and its tributaries. .
#1: Milwaukee
Milwaukee, the Great Lakes (Lake Michigan) entry, is number one. In 2015, the Brewers attracted the equivalent of 1.24 trips to the stadium per capita. This may be surprising, because the Brewers are nowhere near the top in terms of their capacity used during games (approximately 75%) or in their average attendance of 31,000, one-third short of the major league baseball leading Los Angeles Dodgers (46,000).
#2: St. Louis
The expected leader, river-city St. Louis came in second, attracting 1.21 visits per capita. However St. Louis drew many more people than Milwaukee, with an average crowd of more than 44,000. Even if I had wanted to go to a game (I have been to at least one in three decades), it could have been hard to find a seat. The Cardinals filled 98.8% of their seats in 2015. However, they had to settle for second place on this indicator as well, as the San Francisco Giants were number one with 99.4% of their seats filled each game (The timing of this article is purely coincidental with the announced move of the National Football League Rams from St. Louis to Los Angeles: See Note 1)..
#3: Kansas City
The state of Missouri’s other team --- also on a river --- ranked third. Kansas City drew 1.12 fans per capita in 2015. The Royals had an average crowd of 33,000 and filled a creditable 89% of the stadium on average.
#4: Cincinnati
The Cincinnati Reds placed fourth, with an average of 1.09 fans per capita. The Reds, however, had an average crowd of 30,000 and filled only 70% of their seats each game on the banks of the Ohio River.
#5: Pittsburgh
Pittsburgh, also a river city, was in fifth place, with 0.94 fans annual per capita. Pittsburgh’s average attendance was 31,000 and did a bit better in filling its capacity, at 80%.
The Bottom Five
The average fans per capita falls off dramatically among 2015’s bottom five baseball towns.
Last: New York
New York, of course, has two teams, the Yankees in the Mets. The New York fans per capita figure is calculated by adding the attendance figure for its two teams, as is also the case in Los Angeles and Chicago with their two teams. But with a commuting shed of 24 million residents, even filling every seat would not have been enough to grant New York an exit pass from the bottom 5. The Yankees attracted 80% capacity crowds, while the Mets averaged 75%. Overall, New York averaged 0.24 fans per capita, approximately one-fifth that of baseball’s best town in 2015, Milwaukee.
2nd to Last: Philadelphia
Philadelphia ranked second to last, with approximately 0.26 fans per capita. Philadelphia average 23,000 per game, which is only 53% of capacity.
Third to Last: Miami
Miami was third to last, averaging 0.27 fans per capita, with an average crowd of 22,000, which took up 57% of capacity.
Fourth to Last: Atlanta
Atlanta ranked fourth to last, averaging 0.32 trips to the ballpark per capita. The average crowd was 25,000, which represented only 50% of capacity.
Fifth to Last: Houston
Houston ranked fifth to last, slightly above Atlanta at 0.32 fans per capita. The Astros drew 27,000 per game and filled 65% of capacity.
Honorable Mentions and others
As the figure indicates, attendance per capita falls off significantly after fifth ranking Pittsburgh. San Diego and Denver attract approximately 0.75 fans per capita. The Denver is particularly significant, since the Rockies averaged 55,000 per game in 1993, before moving to their specially built stadium. Last year, the best the Rockies could muster was an average crowd of 31,000, filling only 62% of their capacity. The Rockies holds the record of 4.5 million annual attendees in a season, though the New York Yankees have drawn more than 4 million fans in four years. Their best attendance was 4.3 million.
The Toronto Blue Jays (Note 2) are another team that drew more than 4 million fans twice in its heyday and averaged 50,000 fans in 1992. Toronto had been the first team to draw more than 4 million fans, in 1991. The New York Mets also drew more than 4 million fans in 2008, the same year the Yankees drew their largest figure.
As is indicated above, the Los Angeles Dodgers led major league baseball in attendance in 2015. However, just down the road, the Los Angeles Angels--- who play in Anaheim (Orange County) --- ranked fifth in total attendance, giving Los Angeles a combined total of 84,000 between the two teams. The New York Yankees and Mets had a total combined attendance of 70,000. The Chicago Cubs and White Sox drew a combined attendance of 58,000.
Tampa-St. Petersburg put the “if you build it they will come” slogan to the test, in building a domed baseball stadium that opened in 1990. It took major league baseball eight years to come (that is not a record, San Antonio’s Alamo Dome has been waiting for nearly a quarter century for an NFL team). And, at least in 2015, not that many fans came. The Tampa Bay Devil Rays drew the smallest average crowd in the major leagues (15,000) and filled only 45 percent of its seats. Tampa-St. Petersburg did much better in fans per capita, at 0.43, for a ranking of 15th.
My Career as a Baseball Spectator
As may be obvious, I have not been to many baseball games. My first game was on a cross-country Trailways bus trip after high school when I spent my only night in New York at Yankee Stadium. But my most memorable game was in 1978, on the night the Dodgers set the then all-time attendance record (at least then) of 3,000,000 fans in a season. I don’t remember who they played or if the Dodgers won.
Note 1: The off and on again musical chairs game of franchise moves continues with the Cleveland/Los Angeles/St. Louis Rams, which have now become the Cleveland/Los Angeles/St. Louis/Los Angeles Rams. Soon perhaps the Los Angeles/San Diego Chargers will become the Los Angeles/San Diego/Los Angeles Chargers or perhaps the Oakland/Los Angeles/Oakland Raiders will become the Oakland/Los Angeles/Oakland/Los Angeles Raiders?
Note 2: The Toronto commuting shed includes the Toronto, Hamilton and Oshawa metropolitan areas, which Statistics Canada has indicated would be the combined statistical area if they were to designate one.
Wendell Cox is Chair, Housing Affordability and Municipal Policy for the Frontier Centre for Public Policy (Canada), is a Senior Fellow of the Center for Opportunity Urbanism (US), a member of the Board of Advisors of the Center for Demographics and Policy at Chapman University (California) and principal of Demographia, an international public policy and demographics firm. He is co-author of the "Demographia International Housing Affordability Survey" and author of "Demographia World Urban Areas" and "War on the Dream: How Anti-Sprawl Policy Threatens the Quality of Life." He was appointed to three terms on the Los Angeles County Transportation Commission, where he served with the leading city and county leadership as the only non-elected member. He served as a visiting professor at the Conservatoire National des Arts et Metiers, a national university in Paris.
Photo: Best Baseball Town: Milwaukee (2015)
by Greg Hume (Own work) [CC BY-SA 3.0], via Wikimedia Commons


Horrible analysis
Using a single metric to measure "best" is nonsense.
And, for best baseball town you should look at the minors.
And, none of the places listed in the article are "towns", they are all cities.
Dave Barnes
+1.303.744.9024