
A recent piece by Joe Cortright in the City Observatory touched on the often discussed issue of extreme commutes, a favored topic among reporters complaining about sprawl and traffic congestion. The notion of extreme commutes is obviously a fun topic. But it is one that is ripe for analysis based on travel time data that has been available through the Census since 1980 .
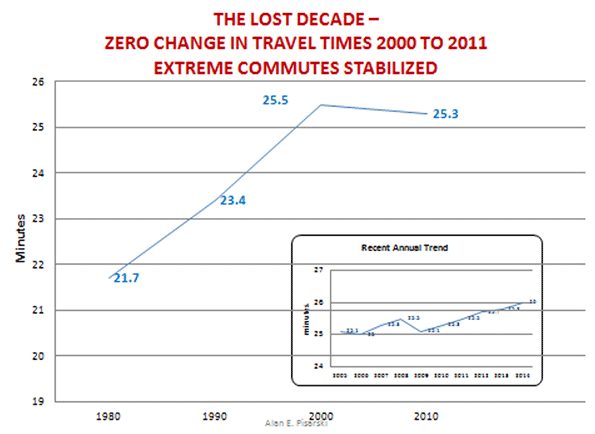
Reporters like to focus on the longest commutes, generally anything more than an hour. In early census data many of the travel time tabulations presented an upper limit category of “45 minutes or more”. The 1980 census showed an average travel time of 21.7 minutes, rising to 22.4 minutes in 1990, a rather trivial increase of about 40 seconds in a decade in which we added 22 million commuters driving alone. Not surprisingly such consumption of our road capacity couldn’t continue and in 2000 average travel times rose by more than three minutes despite an increase on the order of only 13 million solo drivers.
In my early work in Commuting in America I realized that averages are dangerous things, especially when the subject is speeds and travel times, so I began tracking the percentage of commuters who got to work in under 20 minutes and more than 60 minutes. Twenty minutes is used because if you got to work in under 20 minutes you had absolutely nothing to complain about; and if you were over an hour then maybe some sympathy was in order. As the data got better and the travel times got worse the Census Bureau introduced the notion of a 90 minute or greater commute which they labeled an “extreme commute”.
What’s behind it all? Is it as catastrophic as the average reporter will try to make it? (They always manage to find someone who gets up at 4 am and travels three hours on a bus from Pennsylvania to Manhattan). Examining the current trends reintroduced the substantial concern that all analysts must recognize – you have to keep asking: “is this a new trend I am seeing or just another part of the long, slow recovery from an extreme economic event?” The passage of time suggests the latter, often to the disappointment of those who saw a new dawn of the behaviors they tend to endorse. The figure below shows that between 2000 and 2012 travel times were effectively constant at 25.5 minutes. After that, as employment began to improve travel times inched forward to 26 minutes in the 2014 ACS data.
Looking at the longer term patterns, back in 1990 just about half of the workers in America got to work in under 20 minutes. That dropped to 45% in 2000 and now is trending further down to about 43% in 2014. Much of the Midwest is still in that range, and if you add in the dramatic increases in those who work at home then we are still in the 50% range in much of America.
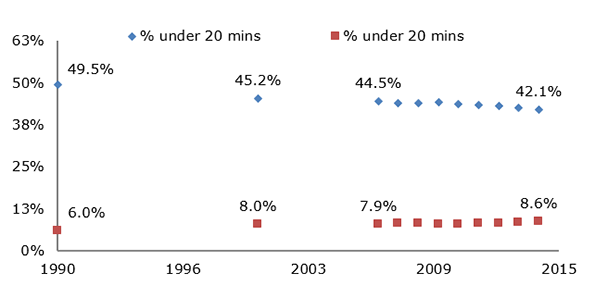
In comparaison the over 60 minutes category is remarkably small. In 1990 we were at about 6% and at 8% in 2000. It has been rising slowly and at the present rate of change we still won’t reach 9% in this decade. Having said that, we must recognize that we are now talking about over 11 million workers in the 60 minute plus category.
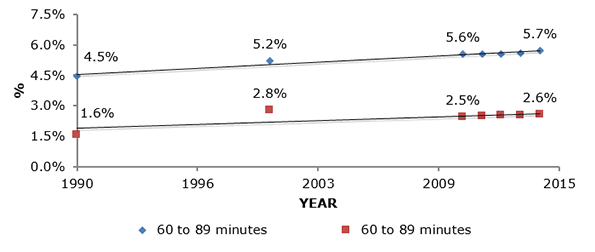
Looking in greater detail at the disaggregate patterns we see that the trend in 60 to 89 minutes continued to rise, while the over 90 minute element dropped off. What happened is that both categories rose through 2008 or so and then with the recession dropped off and now have gone through a slow resumption of expansion in the new decade.
Some of the trends that define travel
One would expect that when jobs are scarce, as during the recent recession and long limited recovery, the average distance people would be willing to travel to find work would increase. Not finding a job in a preferred 30 minute travel time labor market shed around one’s home makes expansion to 45 minutes or an hour more feasible after being unemployed for months. I am sure much of that happened, but the broad statistics tell a varying story. The share of commuters over 90 minutes dropped; two important factors were in play that overwhelmed the statistics:
#1 there’s nothing like 10% unemployment to improve congestion. When the number of workers declined road speeds improved, or at least didn’t continue to get worse. So a previous 90+ minute trip might have improved to 85 minutes. When your travel mate lost his job your solo commute got to be shorter.
#2 The more important factor was that the kinds of jobs lost in the recession were exactly those that tended to be long distance. A large share of the job losses were in construction and factory work. Home construction, of course, mostly occurs at the edges of the region where workers often arrive by carpool. And large factories today are often located in rural areas for logistical purposes – with workers traveling immense distances – for example the car plants and refineries of the south. Note also that there were parallel very severe declines in carpooling in the period. This was at least one of the many factors in that decline. As the economy slowly improved we have seen the return to greater travel times as construction, manufacturing and other activities return and roads congest again.
The significant long term factors we need to recognize in our assessments of future prospects are these:
The key driver of future commuting will be the need to find replacements for the retiring baby-boomers, particularly skilled workers. In general that suggests large metro areas where the access to a variety of workers will be greatest. The larger areas have the best answer to the question “how many people with the skills I need can I reach in a half hour’s travel commuter shed from this location?”
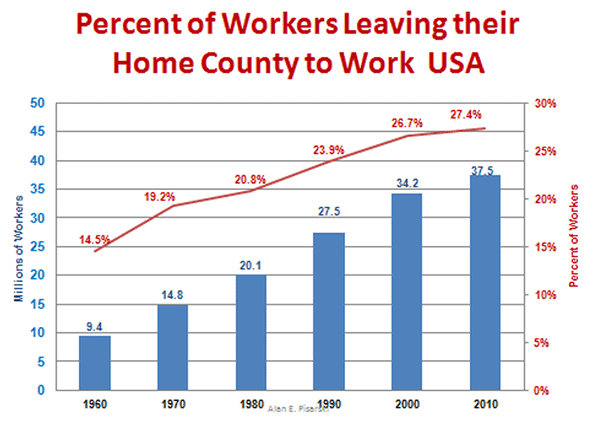
One of the fundamental patterns of American commuting today is massive flows between counties. In 1960 a bit more than nine million workers left their residence county to work, today it is over 37 million and the share of work travel is over 27% almost double the 60’s percentage.
Planners have a dream of better “balance” in jobs and workers in communities that will promote walking/biking to work. Some of that will happen as both suburban and central city Job/Worker ratios approach 1.0 from opposite directions. But the realities of work travel are sharply different. First of all about two-thirds of workers live in a household with other workers – whose job will they live near? Workers, particularly the young, change jobs often. Will they move, incurring costs and further disruption in their lives every time they change jobs? Not likely!
My own county of Fairfax County, Virginia illustrates the national pattern. In 1980 it was a standard bedroom suburb with roughly 400,000 workers and 300,000 jobs for those workers, a J/W ratio of .73, the very definition of a suburb . Flash forward to 2010 and the J/W ratio was at balance, .99, so that if all the workers who could, stayed in the county to work only 8,000 would have to leave to reach available jobs. But, in fact the county exported 280,000 workers and imported 272,000 with an overall flow of over 550,000 crossing its borders every day rather than 8,000. That’s what commuting is really all about. Today, Fairfax County fits the definition of a central city with more jobs than workers yet still the border crossings have reached over 570,000 every day. The key point is that having a numeric balance in jobs and workers has little value, it is the match in the skills needed by employers and the skills possessed by resident workers that is crucial.
Some closing thoughts
These changes in a long term trend of people traveling significant distances to work with an interruption brought on by national employment trends. The current penchant of rail transit proposals to reach farther and farther into the hinterlands to support the central city does not address the dynamic of ever more dispersed employment. Transit has its highest share in trips over 60 minute and are a very significant part of intercounty and interstate travel. The fact that they are a great deal slower than alternatives adds to the shares over 60 minutes. Many of our “metro” systems are closer to being commuter rail lines than city subways, BART, for example, the new Silver line in DC, for another, are excellent example. Think if the entire subway investment in the Washington area had occurred inside the District borders, or at least inside the Beltway, there would have been a very real difference in being inside or not.
We can expect to see longer distance travel as more specialized skills are demanded by employers. I recall in the eighties in China where the workers at the number one bicycle factory lived in apartments across the road and walked across the street every day to work. Even where the government owned the factories, the housing, and the people that still didn’t work. When we are hiring systems engineers or any other highly skilled workforce element it will be even more impossible.
The dominant flow today is circumferential from suburb to suburb from far lower density housing to smaller work places than the number one plant in Shanghai. We don’t live outside the factory gate anymore. About 5% of those who move are seeking a better commute. Most moving focuses on a better place with the amenities the household’s prefer and their commute is often the residual. As hard as we might try, minimizing the commute will not define people’s housing or job patterns in the future. Did I hear someone say autonomous vehicles.
Alan E. Pisarski is the author of the long running Commuting in America series. A consultant in travel behavior issues and public policy, he frequently testifies before the Houses of the Congress and advises States on their investment and policy requirements.
Photo by Nathan Harper, Bottleleaf


