Here's a look at the monthly Office of Federal Housing Enterprise Oversight monthly housing price index by US Census Region. The OFHEO index gives us a little different geographic cut than the popular S&P Case-Shiller Housing Index. We can see the extreme fluctuations in the western US, especially in the Pacific states. These are seasonally adjusted numbers current as of October 2008. The black line, depicting the national composite, finishes at 204 - indicating a doubling of housing prices since 1991, but a fall of 8.8% since its peak in April 2007.
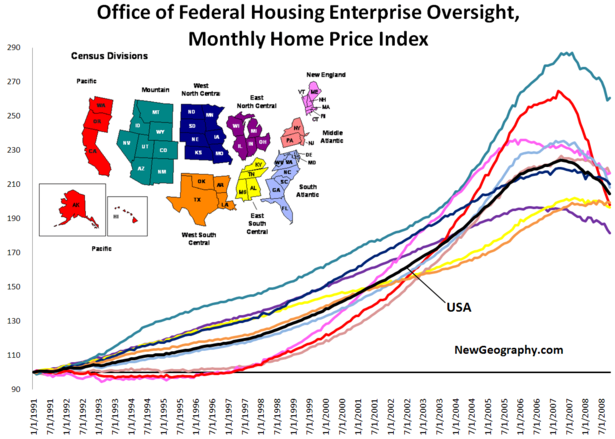
The 8.8% national decline is interesting considering the larger declines depicted by the metropolitan focused Case-shiller index.
Judging by these numbers, the housing prices in the 8 states of the West South Central and East South Central Regions appear to be most stable. The Great Plains states fare remarkably well, and the east coast states are falling in line with the national average. Interestingly, end-to-end growth in the Pacific region ends up about the same as the stable south, yet it took a much more turbulent path to reach that point.
According to OFHEO, the data "is obtained by reviewing repeat mortgage transactions on single-family properties whose mortgages have been purchased or securitized by Fannie Mae or Freddie Mac since January 1975." Here's more on the OFHEO housing price index methodology.


FL vs East South Central
I feel the same way about Fl in the East South Central group. Including FL in that chart overshadows the rest of the E-S-C states. I'll hit the link and see if there are more detailed charts. Real estate, like politics, is a very local affair.
Thanks for the article. Great site.
Clark Mackey
Sparkdog Better Findability
http://www.betterfindability.com
Totally useless
We have Colorado and Arizona lumped into the same region.
The prices of houses in these two states, over the last 5 years, are from different planets.
Dave Barnes
+1.303.744.9024
http://www.MarketingTactics.com
Not useless
Point taken, Dave. The Census regions are dictated by geographic proximity, which is pretty arbitrary for this use. But, Colorado's slow, steady growth would be an anomaly compared to most any state in the area.
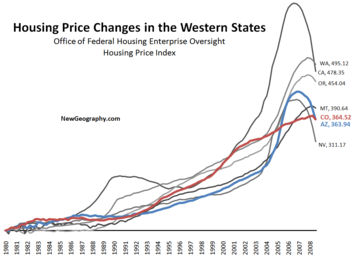
Check out this chart of the same index, but by state.
Click the chart for a bigger version.
Arizona and Colorado are highlighted. If someone just decided to look at percent change 1980 - 2008, it would look about the same. But here we can see that Arizona has been subject to wild fluctuations, while Colorado has been stable.
Also note that Washington and Oregon look similar, probably fueled by exodus from California. Nevada's trajectory is similar to Arizona.
Thanks
Mark,
Good response to my complaint. Personally, I only care about prices in a single neighborhood (Bonnie Brae) of 300 houses in Denver.
Dave Barnes
+1.303.744.9024
http://www.MarketingTactics.com