
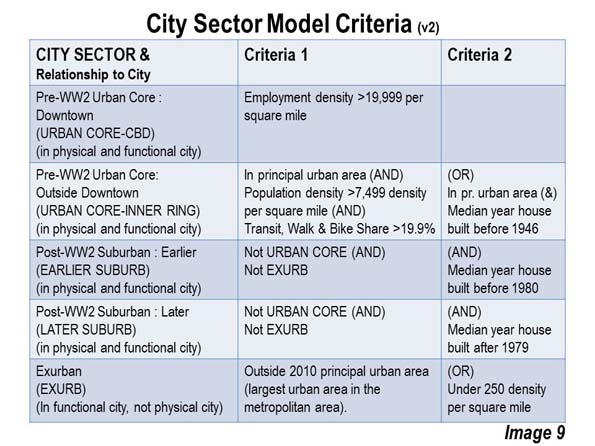
After decades of serious economic decline, the inner cores in many of America’s largest metropolitan areas have experienced much improvement in recent years. This is indicated by the “City Sector Model,” (Image 9) which we developed to analyze the largest cities (metropolitan areas) using small functional areas, ZIP Code calculation areas (ZCTAs). The 2015 update to the City Sector Model added a fifth broad category of urbanization, when the Urban Core was divided into the Urban Core: CBD, and the Urban Core: Inner Ring (hereinafter referred to as CBD and Inner Ring).
The CBDs have far higher densities of employment and population than the surrounding Inner Rings that surround them. The largest CBDs are nearly all products of the pre-World War II period, when metropolitan employment was more concentrated. Overall both the CBD and the Inner Ring are more similar than not, with higher densities than the suburban and exurban sectors and with greater use of transit, walking and bicycles in commuting. In contrast, the suburban and exurban areas have near universal use of automobiles.
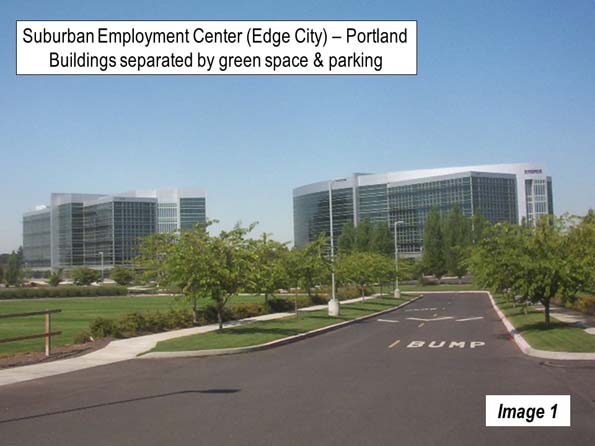
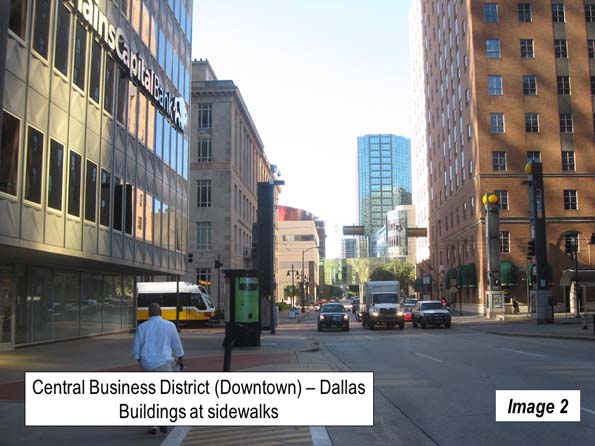
This article includes analysis of the Urban Core: CBD (CBD) using the latest data from the American Community Survey for 2010 to 2014 (Note 1), with a middle year of 2012. The defining feature of the CBD is high employment densities. The City Sector Model uses employment densities of 20,000 and greater for designation of the CBDs. There are other dense employment centers in metropolitan areas, such as the “edge cities,” but they tend to be characterized by less concentrated development with their buildings, including high-rises, separated by green spaces and parking lots (Image 1). CBDs, on the other hand, typically have their high-rise buildings adjacent to street oriented sidewalks, with less space between the buildings (Image 2).
Population Trends
Since 2000, the CBDs have added approximately nine percent to their population. The CBD population growth rate largely tracked the overall metropolitan area growth rate. Critically, these remain a very small part of the urban population. Some 1.3 percent of the metropolitan population lived in the CBD in 2000, a figure that remained virtually the same in 2012.
This growth rate, however, was not sustained throughout the Urban Core, which includes the much larger Inner Ring. The Inner Ring, which includes 91 percent of the Urban Core population, grew only 0.3 percent. The much larger Inner Ring drops the Urban Core growth rate down to only 0.9 percent, far below the 9 percent in the CBD component. The other functional sectors grew faster, from two percent in the Earlier Suburbs to 39 percent in the Later Suburbs.
Becoming More Residential
Historically largely business districts, CBDs are becoming much more residential. Old, largely abandoned commercial buildings have been converted to new apartments and condominiums. In some places, there is new residential construction. There are new restaurants and other amenities that are associated with vibrant residential areas. There is more of a look of prosperity.
Indeed, it may be surprising, given these developments that CBDs have not grown more. The net effect is that of the nearly 20 million new major metropolitan area residents added since 2000, less than 0.1 percent have been in the CBDs. However, as some people have moved in, others have moved out (Note 2).
The growth in CBD population has been dominated by higher income ethnicities (Image 3). While the CBDs were adding 175,000 residents, the growth in Asian and White-Non-Hispanic residents was 215,000. African-American population declined more than 50,000, while Hispanic population edged up less than 10,000.
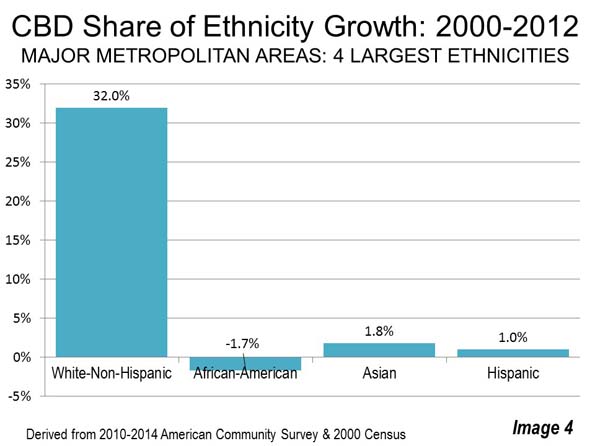
Astoundingly, the CBDs, with barely one percent of the population, have attracted 32 percent of the major metropolitan White-Non-Hispanic growth. The 135,000 growth in White-Non-Hispanics compared to their slow, overall growth of 435,000. The share of the population growth among African-Americans, Asians and Hispanics in the CBDs has been far less (Image 4).
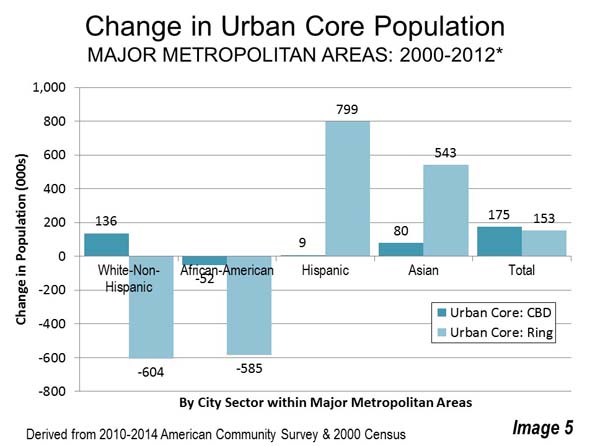
Trends in the Inner Ring have been much different. There has been an exodus of approximately 600,000 of both white non-Hispanics and African-Americans. This has been somewhat more than offset by increases in the Asian and Hispanic population. Since 2000, Inner Ring has gained approximately 150,000 residents, somewhat less than the 175,000 gain in the CBDs (Image 5).
The CBD Employment Market
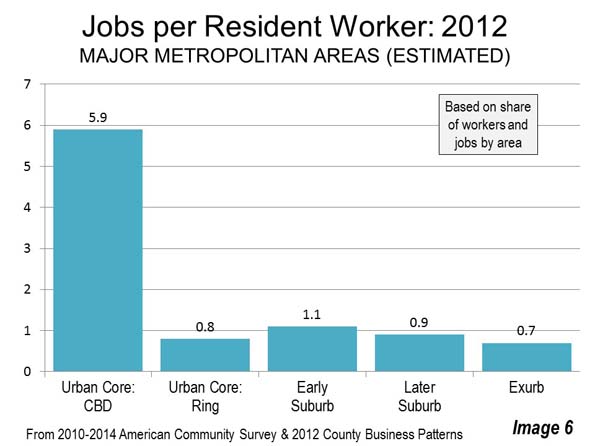
Another defining feature of CBDs is a huge imbalance between employed residents and jobs. The most recent data indicates that the CBD boasts nearly six jobs for every employed resident. Elsewhere in the metropolitan areas there was a much closer balance between jobs and resident workers (Image 6).
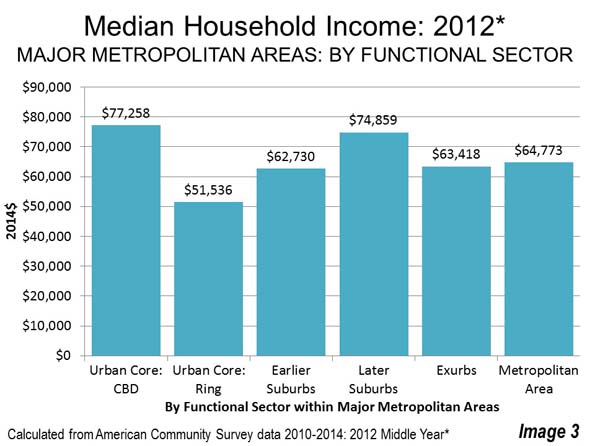
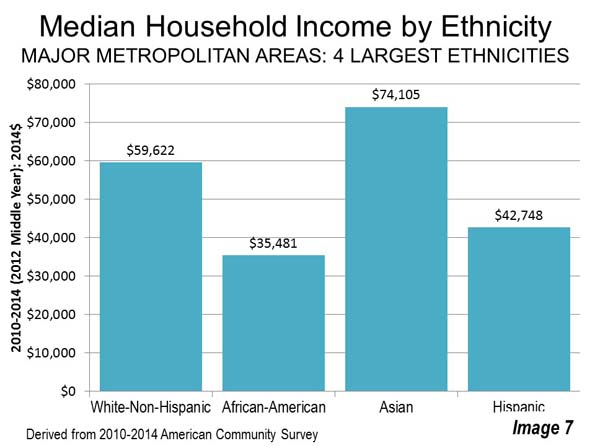
This huge excess of jobs provides a rich employment market for residents. This and the growth in higher income ethnicities have combined to make the CBDs the most affluent sector in the major metropolitan areas by 2012, at nearly $77.300. This compares to the overall median household income of $64,800, the second ranking $74,900 in the Later Suburbs and the $51,600 in the Inner Ring. The median household income in the Inner Ring was by far the lowest (Image 7).
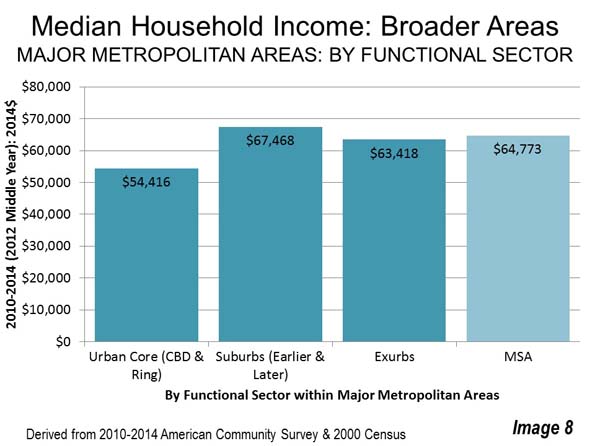
Overall, as we speak about the core, the lower incomes of the Inner Ring dwarf the higher incomes in the CBD. Overall, the Urban Core (including the CBD and Inner Ring) median household income is $54,400, approximately 30 percent below that of the CBD (Image 8), and well below incomes in the suburbs, exurbs and metropolitan area as a whole.
Assessing CBD Progress
The CBDs have made significant progress. This is an important development because they, like other sectors of the city, best play their part as vibrant and healthy areas, rather than the depressed places that they used to be. They have attracted many younger people (Millennial age).
In context, however, the progress in the CBD has been more symbolic than substantive. The CBD is not a model for what the rest of the metropolitan area. It cannot be. Metropolitan areas are labor markets. This means that they have a jobs to resident worker ratio of approximately 1.0. By definition, labor markets cannot have six times as many jobs as employees. Even with their impressive attraction of younger people, more than 97 percent of Millennial population growth since 2000 has been outside the CBDs.
CBD population growth has been impressive, but small in relation to the metropolitan area. When combined with the much larger urban core component, the Inner Ring, its income advantage and demographic dynamism fades. Reviving the CBDs is a good thing. But the much larger Inner Ring needs revival as well.
The bottom line: the city is better off when all of its component parts are healthy, from the core to the exurbs.
Note 1: This is the latest available data for small areas and was collected from 2010 to 2014. Thus, approximately one-fifth of the data was collected in each of the five years. For convenience, this article refers to the data as being reflective of 2012 (the middle year).
Note 2: The ethnic analysis is based on one-race and Hispanic data. This represents 98 percent of the major metropolitan area population.
Wendell Cox is principal of Demographia, an international public policy and demographics firm. He is a Senior Fellow of the Center for Opportunity Urbanism (US), Senior Fellow for Housing Affordability and Municipal Policy for the Frontier Centre for Public Policy (Canada), and a member of the Board of Advisors of the Center for Demographics and Policy at Chapman University (California). He is co-author of the "Demographia International Housing Affordability Survey" and author of "Demographia World Urban Areas" and "War on the Dream: How Anti-Sprawl Policy Threatens the Quality of Life." He was appointed to three terms on the Los Angeles County Transportation Commission, where he served with the leading city and county leadership as the only non-elected member. He served as a visiting professor at the Conservatoire National des Arts et Metiers, a national university in Paris.
Photo: Kansas City CBD (by author)


