
Statistics Canada has just announced population counts from the 2016 census and the narrative is all about the Prairie Provinces. Alberta, Saskatchewan and Manitoba (yes, Manitoba) were the three fastest growing provinces. Metropolitan area growth was dominated by the Prairies, along with metropolitan areas outside the largest in Ontario and British Columbia.
Provincial Results
An analysis in the Globe and Mail indicates that Canada has been the fastest growing among the G7 nations. Since the last census (2011), Canada grew at a rate of 1.0 percent. This is above the 0.8 percent rate of the United States (which fell to 0.7 percent in 2015-2016). Canada’s growth rate was also well above that of the United Kingdom (0.7 percent) and five times the rate of the European Union (0.2 percent) and 10 times that of Germany (0.1 percent).
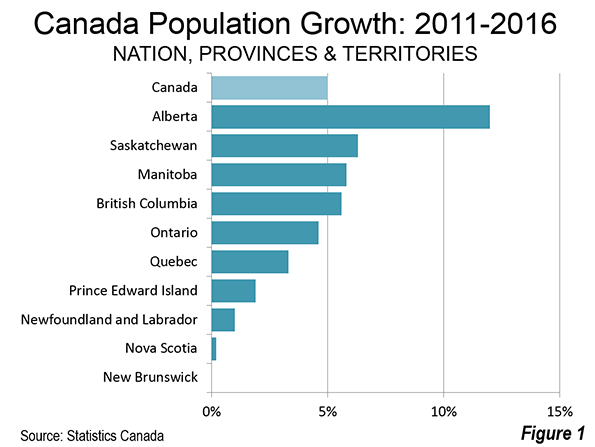
Perhaps most astoundingly, British Columbia, which had shared growth leadership with Alberta since 1951 was pushed to fourth place in growth (5.6 percent).
Leader Alberta grew 11.6 percent, while perennial slow growers Saskatchewan (6.3 percent) and Manitoba (5.8 percent), took the second and third positions. British Columbia grew only 5.6 percent, down from 7.0 percent between 2006 and 2011. The last time that Manitoba grew faster than British Columbia was in the 10 years before 1911, when Sir Wilfred Laurier was Prime Minister, William Howard Taft was President of the United States and eventual war leader H. H. Asquith was British Prime Minister.
Usually strong growth Ontario, which accounts for nearly 40 percent of the national population, grew slower than Canada (5.0 percent), at 4.6 percent. This repeats the less than stellar performance of 2006 to 2011 and is the first time this has happened since World War II.
Canada has three territories, all in the far north. Two grew rapidly, including Nunavut (12.7 percent) and Yukon (5.8 percent). Their populations, however, are very small, approximately 35,000 each. Nunavut covers a land area three times that of Texas, while Yukon is larger than California.
Growth in Metropolitan Areas
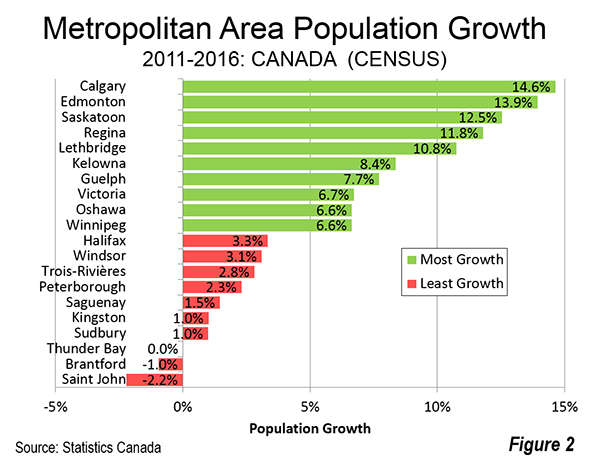
The same pattern can be seen in metropolitan areas (Table). Fastest growth among the 34 census metropolitan areas (CMA) was centered in the Prairie Provinces. Six of the fastest growing 10 metropolitan areas were in Alberta, Saskatchewan and Manitoba. Calgary grew the fastest, adding 14.6 percent to its population. Edmonton, Calgary’s neighbor to the north, and the capital of Alberta was the second fastest growing, at a 13.9 percent rate over the five years. These two metropolitan areas had seen some stalling of their prodigious growth due to oil industry reverses, however with petroleum prospects improving, could well see even greater growth in the years to come.
More surprising has been the growth in the historically slow growing plains provinces just to the east. Saskatchewan’s two metropolitan areas were the next fastest growing. Saskatoon grew 12.5 percent. Regina, the provincial capital, grew 11.8 percent. These are strong growth rates for the Saskatchewan metropolitan areas, which until a decade ago had experienced a long period of slow growth.
Lethbridge, Alberta’s third metropolitan area grew 10.8 percent, rounding out a top five in which all were from the Prairie Provinces.
The next four positions were occupied by metropolitan areas near the largest (Toronto) and the third largest (Vancouver). Kelowna and Victoria, in British Columbia grew 8.4 percent and 6.7 percent respectively. In Ontario, Guelph and Oshawa grew 7.7 percent and 6.6 percent, respectively. This represented a shift in growth from the two larger metropolitan areas, which experienced an approximately one-third drop in their growth rates from the previous intercensal period (2006-2011), when they ranked in the top 10 in growth. Part of the reason for the greater growth in the metropolitan areas outside Vancouver and Toronto is their lower house prices. Vancouver’s housing affordability was the third worst out of 92 major metropolitan areas in the 2017 Demographia International Housing Affordability Survey, while Toronto was 14th worst.
Winnipeg, the capital of Manitoba, was the 10th fastest growing, at 6.6 percent, and rounded out the six fast growing Prairie province metropolitan areas. Winnipeg’s growth over the last decade, like that of Saskatoon and Regina, is an important turnaround from its previous slower pace. Winnipeg grew faster than Toronto, Vancouver and Ottawa-Gatineau.
The slowest growing metropolitan area was Saint John, New Brunswick lost 2.0 percent of its population. Six of the slowest growing (and losing) metropolitan areas were in Ontario. Brantford lost 1.0 percent of its population, while Thunder Bay had virtually no change. The other Ontario metropolitan areas in the bottom ten included Sudbury, Kingston, Peterborough and Windsor (just across the Detroit River from Detroit). Two Québec metropolitan areas were among the slowest growing, Saguenay and Trois-Rivières. Halifax, the capital of Nova Scotia was the 10th slowest growing, at 3.3 percent (Figure 2).
As has been the case for the 45 years since it displaced Montréal, Toronto was Canada’s largest metropolitan area according to the 2016 Census, with a population of 5.9 million. Montréal held on to second place, with a population of 4.1 million. Vancouver was third, with a population nearing 2.5 million.
Three metropolitan areas were bunched within a range of little more than 70,000. Calgary had a population of 1,393,000. The federal capital, Ottawa-Gatineau, which stretches across the Ottawa River, located on the border between Quebec and Ontario, had a population of 1,324,000 and had led Calgary in 2011. Edmonton nearly duplicated the Ottawa-Gatineau number, at 1,321,000. Estimates in 2015 had placed Edmonton higher than Ottawa-Gatineau, but were not confirmed by the new Census numbers.
The remaining four top ten gainers maintained their 2011 positions. Québec ranked 7th, followed by Winnipeg, Hamilton (in the greater Toronto area) and Kitchener-Waterloo, Canada’s Silicon Valley.
| Canada Metropolitan Areas: Population | ||||||
| 2011 to 2016 Census | ||||||
| Rank | Metropolitan Area | 2011 | 2016 | Change | % | % Rank |
| 1 | Toronto | 5,583,064 | 5,928,040 | 344,976 | 6.2% | 12 |
| 2 | Montréal | 3,934,078 | 4,098,927 | 164,849 | 4.2% | 20 |
| 3 | Vancouver | 2,313,328 | 2,463,431 | 150,103 | 6.5% | 11 |
| 4 | Calgary | 1,214,839 | 1,392,609 | 177,770 | 14.6% | 1 |
| 5 | Ottawa - Gatineau | 1,254,919 | 1,323,783 | 68,864 | 5.5% | 15 |
| 6 | Edmonton | 1,159,869 | 1,321,426 | 161,557 | 13.9% | 2 |
| 7 | Québec | 767,310 | 800,296 | 32,986 | 4.3% | 19 |
| 8 | Winnipeg | 730,018 | 778,489 | 48,471 | 6.6% | 10 |
| 9 | Hamilton | 721,053 | 747,545 | 26,492 | 3.7% | 23 |
| 10 | Kitchener - Waterloo | 496,383 | 523,894 | 27,511 | 5.5% | 14 |
| 11 | London | 474,786 | 494,069 | 19,283 | 4.1% | 21 |
| 12 | St. Catharines - Niagara | 392,184 | 406,074 | 13,890 | 3.5% | 24 |
| 13 | Halifax | 390,328 | 403,390 | 13,062 | 3.3% | 25 |
| 14 | Oshawa | 356,177 | 379,848 | 23,671 | 6.6% | 9 |
| 15 | Victoria | 344,580 | 367,770 | 23,190 | 6.7% | 8 |
| 16 | Windsor | 319,246 | 329,144 | 9,898 | 3.1% | 26 |
| 17 | Saskatoon | 262,215 | 295,095 | 32,880 | 12.5% | 3 |
| 18 | Regina | 211,519 | 236,481 | 24,962 | 11.8% | 4 |
| 19 | Sherbrooke | 202,261 | 212,105 | 9,844 | 4.9% | 17 |
| 20 | St. John's | 196,954 | 205,955 | 9,001 | 4.6% | 18 |
| 21 | Barrie | 187,013 | 197,059 | 10,046 | 5.4% | 16 |
| 22 | Kelowna | 179,839 | 194,882 | 15,043 | 8.4% | 6 |
| 23 | Abbotsford - Mission | 170,191 | 180,518 | 10,327 | 6.1% | 13 |
| 24 | Sudbury | 163,067 | 164,689 | 1,622 | 1.0% | 31 |
| 25 | Kingston | 159,561 | 161,175 | 1,614 | 1.0% | 30 |
| 26 | Saguenay | 158,658 | 160,980 | 2,322 | 1.5% | 29 |
| 27 | Trois-Rivières | 151,773 | 156,042 | 4,269 | 2.8% | 27 |
| 28 | Guelph | 141,097 | 151,984 | 10,887 | 7.7% | 7 |
| 29 | Moncton | 139,287 | 144,810 | 5,523 | 4.0% | 22 |
| 30 | Brantford | 135,501 | 134,203 | (1,298) | -1.0% | 33 |
| 31 | Saint John | 129,057 | 126,202 | (2,855) | -2.2% | 34 |
| 32 | Peterborough | 118,975 | 121,721 | 2,746 | 2.3% | 28 |
| 33 | Thunder Bay | 121,596 | 121,621 | 25 | 0.0% | 32 |
| 34 | Lethbridge | 105,999 | 117,394 | 11,395 | 10.8% | 5 |
| Source: Statistics Canada | ||||||
Photograph: Flag of Canada
Wendell Cox is principal of Demographia, an international public policy and demographics firm. He is a Senior Fellow of the Center for Opportunity Urbanism (US), Senior Fellow for Housing Affordability and Municipal Policy for the Frontier Centre for Public Policy (Canada), and a member of the Board of Advisors of the Center for Demographics and Policy at Chapman University (California). He is co-author of the "Demographia International Housing Affordability Survey" and author of "Demographia World Urban Areas" and "War on the Dream: How Anti-Sprawl Policy Threatens the Quality of Life." He was appointed to three terms on the Los Angeles County Transportation Commission, where he served with the leading city and county leadership as the only non-elected member. He served as a visiting professor at the Conservatoire National des Arts et Metiers, a national university in Paris.


