
With little fanfare, the American Public Transportation Association (APTA) released its fourth quarter 2016 ridership report last week. When ridership goes up, the lobby group usually issues a big press release ballyhooing the importance of transit (and transit subsidies). But 2016 ridership fell, so there was no press release.
The report showed that light-rail ridership grew by 3.4 percent, probably because of the opening of new light-rail lines such as Seattle, where the opening of the University line increased ridership by 60 percent. In the past, light-rail ridership has grown with the addition of new lines, but the number of passengers per mile of light rail has fallen, indicating diminishing returns to new rail construction.
Commuter-rail ridership grew by 1.6 percent, mostly due to growth in New York City. Trolley bus ridership grew by 1.8 percent, almost all of which was in San Francisco. Demand-response (paratransit) grew by 0.7 percent.
The two most important modes, however, both declined: heavy rail fell by 1.6% and buses by 4.1 percent. Since these two modes together carry 86 percent of transit riders, their decline swamped the growth in other modes. “Other,” which includes ferries, monorails, and people movers, also fell by 0.2 percent.
In some cases, the decline in bus ridership more than made up for increases in rail ridership. Phoenix light-rail ridership grew by 10.6 percent, but for every light-rail rider gained, Phoenix transit lost nearly four bus riders. Los Angeles light-rail ridership grew by 8.7 percent, but for every light-rail rider gained, Los Angeles lost nearly six bus riders. Ridership on Nashville’s Music City Star grew by 2.6 percent, but the city lost more than 30 bus riders for every new rail rider. Denver opened a new rail line to the airport but lost more than 1-1/2 bus riders for every rail rider gained. Charlotte lost more than 15 bus riders per new rail rider, while Portland lost nearly 2 bus riders per new light-rail rider.
Other major rail systems couldn’t even record gains. Washington’s Metrorail fell by 10.4 percent; Atlanta fell by 4.7 percent; and the biggest shock of all, New York City subways fell by 0.8 percent. Heavy-rail ridership also feel in in Baltimore (-13.2%), Chicago (-1.3%), Miami (-3.8%), and Philadelphia (-4.5%), among other places.
Ridership on Boston’s aging subway lines fell by 0.2 percent. As in Washington, the Boston subway is experiencing maintenance problems, including smoke in the tunnels. MBTA has ordered new rail cars, one of which was put on display this week. As columnist Teresa Hanafin noted on Tuesday in the Boston Globe,
Governor Charlie Baker and state transpo and T officials tour the new Orange Line trains at noon in Medford. The new cars are terrific: They come equipped with sneakers that riders can borrow when the trains break down and they have to walk to the next station, paperbacks to read during the daily delays, hair dryers so riders can help T workers warm up the tracks during cold weather, tasers to ward off gropers, vomit bags, nose plugs, hand sanitizer, and cheese vending machines so riders can feed the rats. Isn’t technology great?
Light-rail ridership declined in, among other places, Buffalo (-6.1%), Cleveland (-4.7%), Dallas (-1.7%), Minneapolis (-0.2%), Philadelphia (-6.0%), Pittsburgh (-4.3%), St. Louis (-4.6%), and Sacramento (-3.5%). Commuter-rail ridership fell in Albuquerque (-7.7%), Austin (-3.5%), Dallas-Ft. Worth (-6.1%), Los Angeles (-4.3%), Maryland (-1.9%), Miami (-1.6%), Orlando (-8.5%), and Philadelphia (-5.9%), among other places.
Salt Lake City has been getting more federal transit funding per capita than any other urban area, but the region seems to be losing its bet on light rail and commuter rail. Except for paratransit, every mode of transit in the region declined. The same thing happened in Dallas-Ft. Worth, which has built more light rail than any region in the country. Transit in San Jose, home of one of the nation’s worst-managed transit agencies, took a real nosedive, losing 10.0 percent of light-rail riders and 8.5 percent of bus riders.
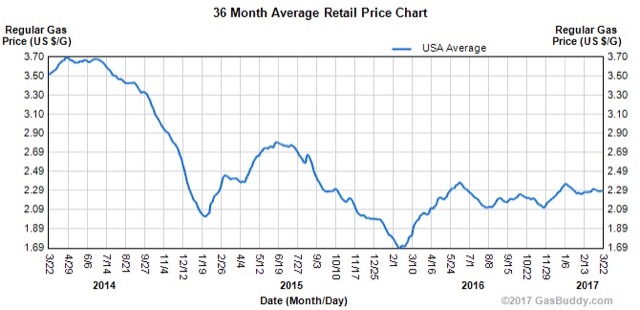
APTA will no doubt blame these declines on low gasoline prices. Prices for regular gasoline in 2016 averaged $2.14, about 12 percent less than 2015’s $2.43. Prices in 2016 were also less variable, which might have given people more confidence in driving. Perhaps more important, per capita incomes grew by 3.5 percent, which probably contributed more to near-record auto sales than low gas prices (though the low fuel prices influenced people’s choices of what vehicles to buy).
The transit industry bills itself as providing necessary transportation for low-income riders and alternative transportation for choice riders. Whether because of low gas prices, rising incomes, or growing shared-car services, low-income commuters are buying cars and higher-income travelers are making a choice not to use transit. In the face of these choices, transit agencies that want to spend hundreds of millions or billions on fixed-guideway transit, either rail or dedicated bus lanes, are wasting peoples’ money.
Randal O’Toole is a senior fellow with the Cato Institute specializing in land use and transportation policy. He has written several books demonstrating the futility of government planning. Prior to working for Cato, he taught environmental economics at Yale, UC Berkeley, and Utah State University.
Photo: Wade Rockett, CC License.


