
Senior citizen populations continue to increase faster in the suburbs and exurbs of major US metropolitan areas (over 1,000,000 populations). This is the conclusion of a City Sector Model analysis of the small area (zip code) trend from 2010 to the latest American Community Survey (ACS) 5-year data (2012/2016). The American Community Survey is taken on a rolling basis over a five year period, with the annual “slices” combined to obtain a picture of the national situation. Between decennial censuses (the next due in 2020). small area data is available only from the ACS 5-year surveys.
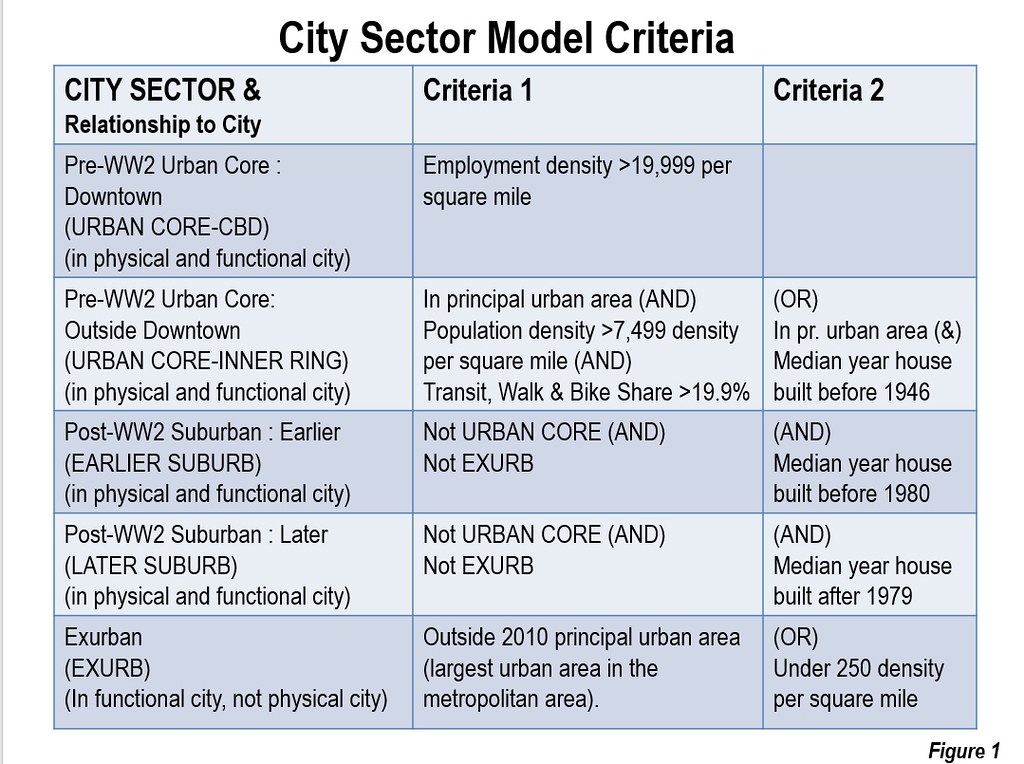
The City Sector Model classifies small areas based on the nature of their functional urbanization as opposed to by political jurisdictions, which can vary substantially in factors such as population density, employment density, automobile orientation and age of development. The City Sector Model criteria are illustrated in Figure 1 (Note).
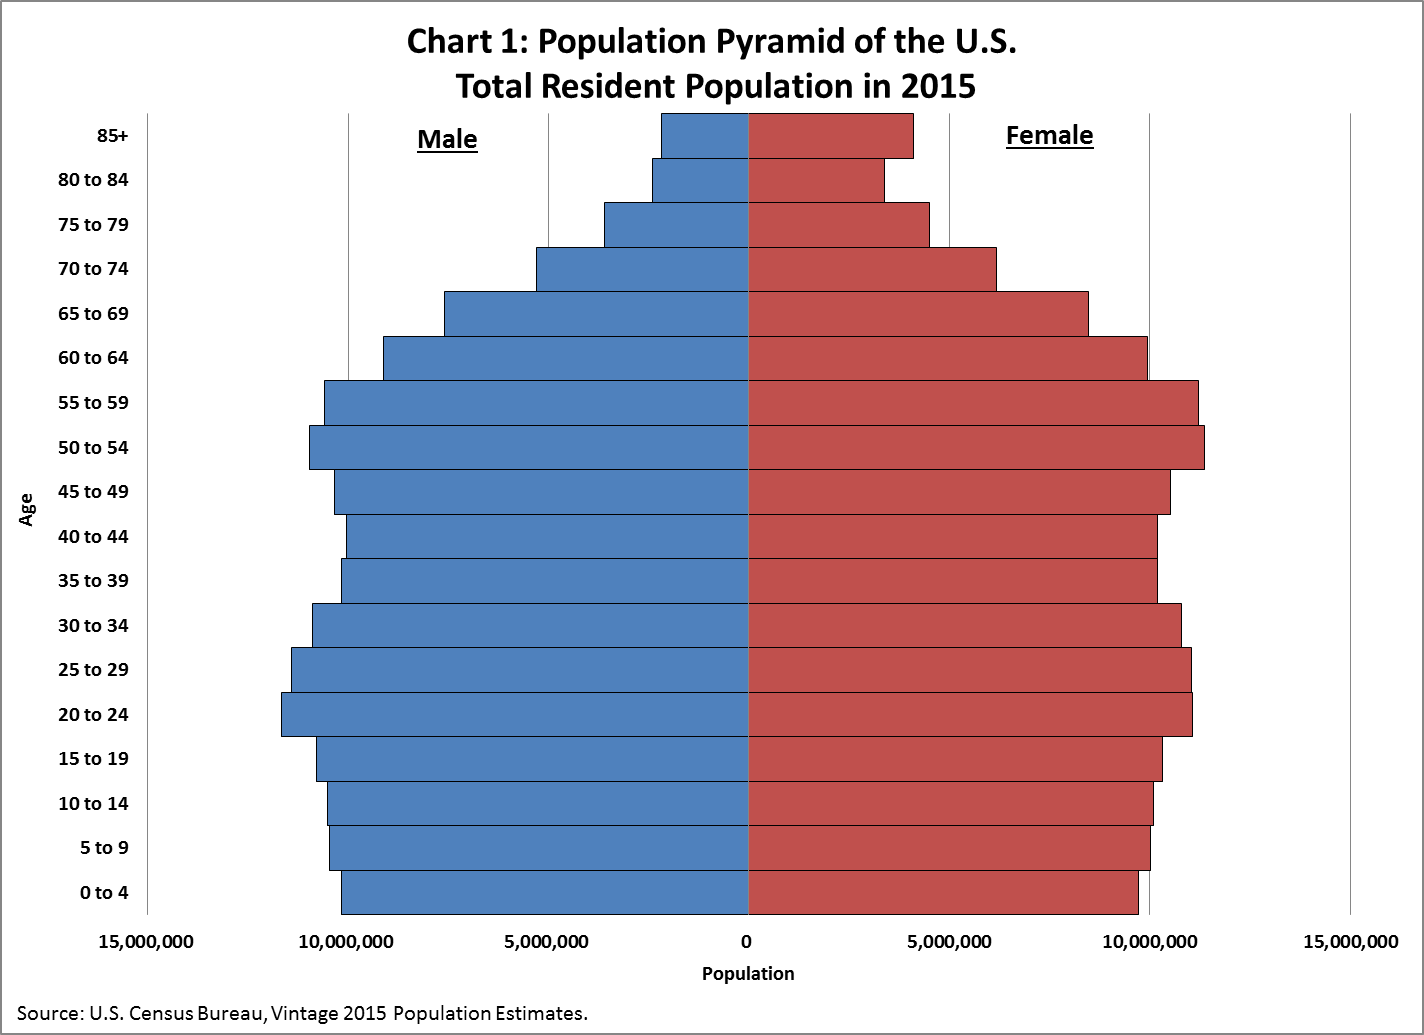
The percentage of the population 65 or over is increasing rapidly both in the United States and in other countries, principally due to declining fertility rates and longer lifespans. Census Bureau projections indicate that the share of the population 65 or over will increase more than one quarter from 2010 to 2020. The Census Bureau population pyramid indicates that the age cohorts reaching 65 over the next 15 years are increasingly large (See photograph above).
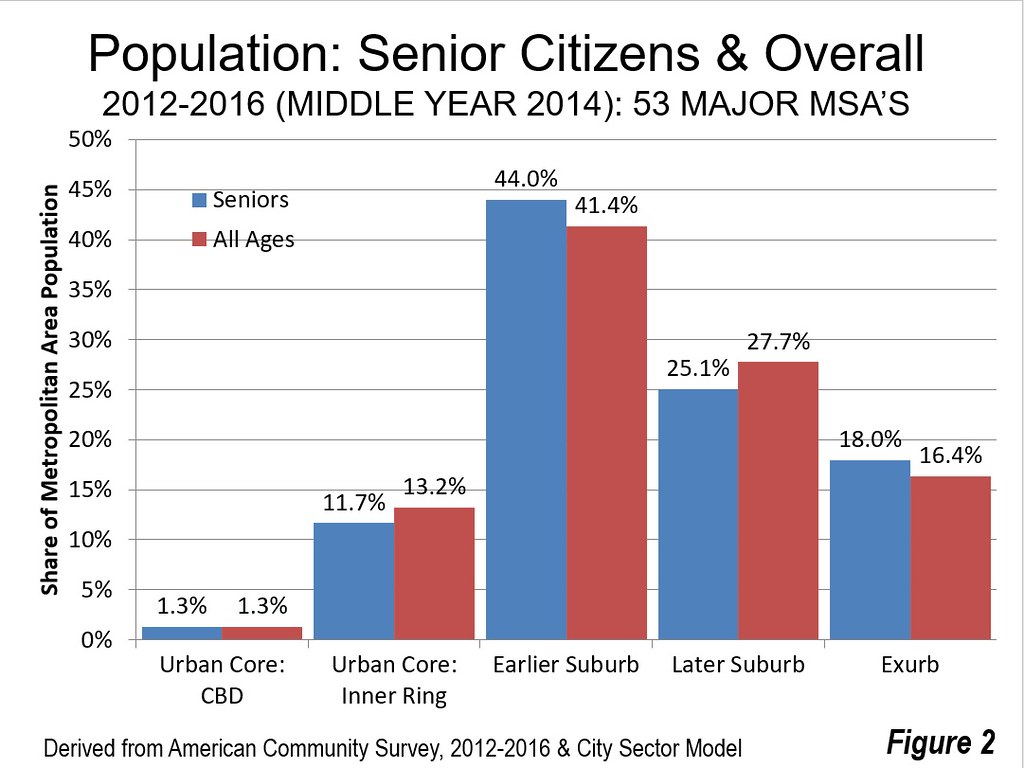
The distribution of senior population in the major metropolitan areas is similar to that of the overall population, though seniors tend to be more congregated outside the urban core than people of all ages (Figure 2). Overall, 13.0 percent of the senior population lives in the two Urban Core classifications (CBD or Central Business District and Inner Ring), while 87.0 percent lives in the three classifications outside the Urban Core (Earlier Suburban, Later Suburban and Exurban classifications). This is similar to the distribution of the population of all ages, which is 14.5 percent in the urban core and 85.5 percent in the suburbs and exurbs.
The reality is that senior citizens are predominantly staying in their predominantly suburban or exurban communities. In 2000, 15.5 percent of seniors lived in the urban cores of the major metropolitan areas. By 2010, the share of seniors living in urban cores had declined to 13.7 percent. This included 1.4 percent in the Urban Core: CBD (Central Business District) and 12.3 percent in the Urban Core: Inner Ring. By 2012/2016 the share of senior population living in the urban cores dropped to 13.0 percent, 1.3 percent in the CBDs and 11.7 percent in the Inner Rings. Less than 10 percent of the senior growth (9.4 percent) from 2010 was in the Urban Core.
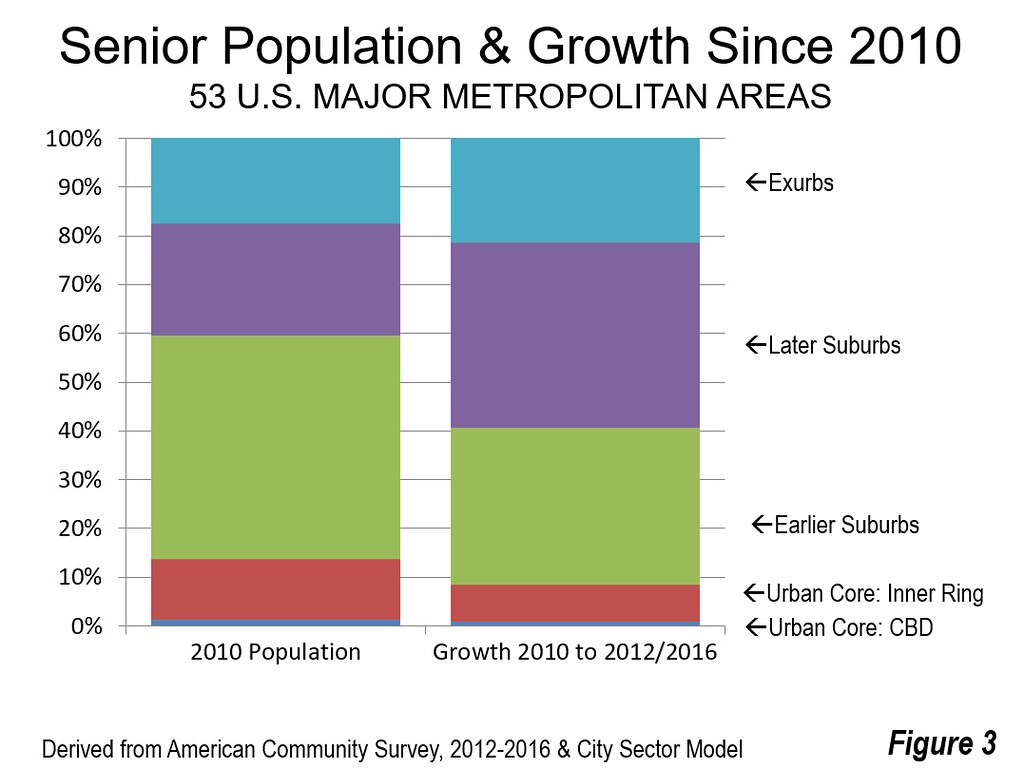
The overwhelming majority of the senior population growth was in the suburbs and exurbs. In 2010, 86.3 percent of the senior population was suburban or exurban. By 2012/2016, this figure had edged up to 87.0 percent. More than 90 percent of the senior population growth was in the suburbs and exurbs (Figure 3).
These results are counter to the periodic anecdote-based press reports of seniors moving to the urban core. (for example, a Business Insider story “Millions of Seniors Are Moving Back to the Big Cities”). However, anecdotes reveal trends only when they add up, and in this case they do not. The reality is that, since 2000, the net increase in the urban core senior population has been nearly 85 percent short of a single million (only 156,000). In contrast, the senior increase in the suburbs and exurbs has been nearly six times a million (5,900,000). Seniors, like other age groups, increasingly live in the suburbs and exurbs (Figure 4).
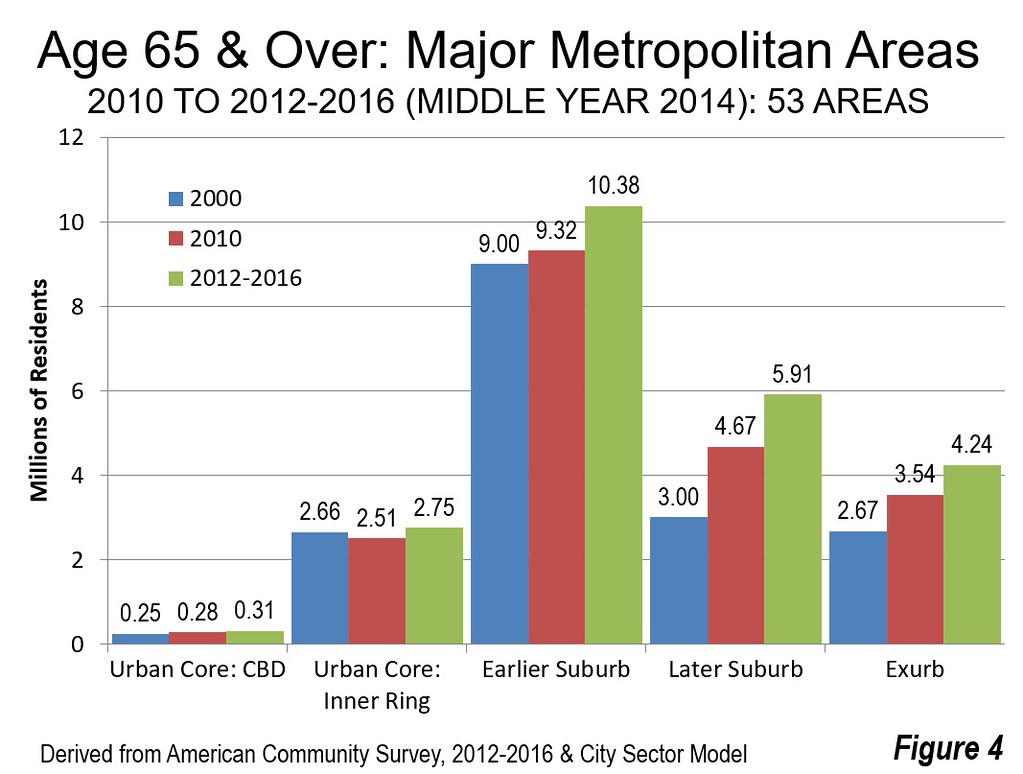
In numeric terms, the Later Suburbs (generally outer suburbs) gained approximately 1.25 million seniors. The Earlier Suburbs (generally inner suburbs) gained nearly 1.1 million, while the exurbs gained 700,000. These more automobile oriented components of metropolitan areas gained considerably more than the Urban Core components. The Urban Core: Inner Ring added nearly 250,000, while the Urban Core: CBD added 30,000 (Figure 5).
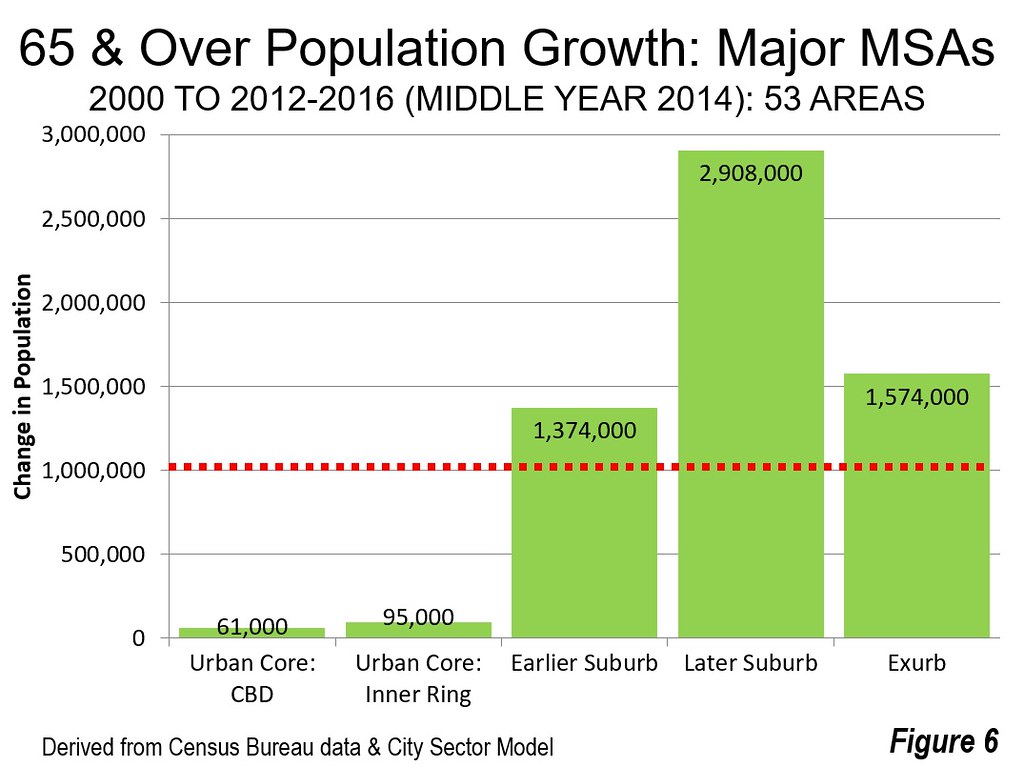
With the increasing share that seniors represent of the overall population, the growth rates are substantial in each of the City Sector Model categories. Senior population has been growing at 3.6 percent annually in the major metropolitan areas. This is approximately five times the recent rate for the total population in the United States (Figure 6).
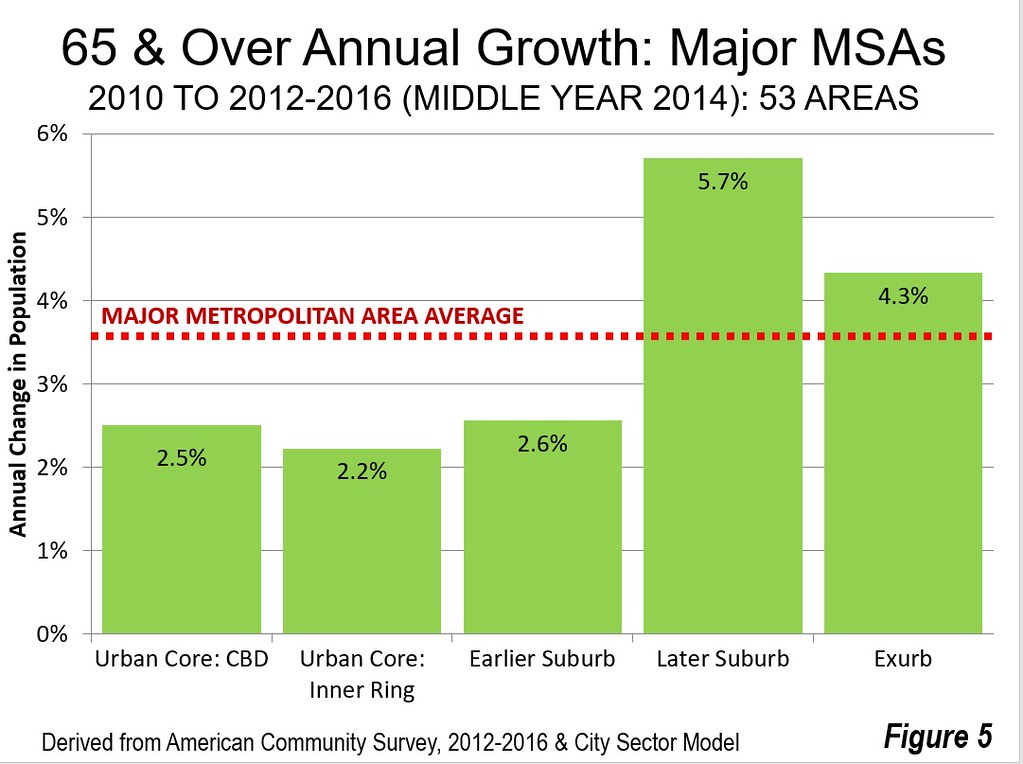
The fastest senior growth rate has been in the Later Suburbs, at 5.7 percent annually, well above the 3.6 overall senior increase average. The Exurbs have also been growing faster than the overall senior population, at 4.3 percent. The Earlier Suburbs (2.6 percent), Urban Core: Inner Ring (2.2 percent) and the Urban Core: CBD (2.5 percent) have been growing more slowly. However, each of the sectors is growing at a rate considerably above the national average for the entire population, as the share of population over 65 years of age is increasing.
By far the strongest senior growth in an urban core was in New York, where the urban core represented 46.1 percent of the senior population growth. However, the growth share was somewhat below the 2010 senior population share of 48.3 percent. The majority of the New York senior growth was in the suburbs and exurbs (53.9 percent).
The second strongest senior growth share in an urban core was in Boston, at 23 percent. Among the major metropolitan areas, only seven, including more than 10 percent of the senior growth into their urban cores (San Francisco, Chicago, Providence, Philadelphia and Cleveland, New York and Boston). In each of these metropolitan areas, the senior urban core growth rate was considerably less than their senior share in 2010, ranging from a deficit of five percentage points to over 13.
Where seniors choose to live will become more important in the coming decades, not only due to their growing numbers and far greater wealth than younger generations. Their trends, at least for the next decade or so, will be as important, economically maybe more so, than the oft-studied millennials.
------
Note: The City Sector Model classifies all zip codes in the United States based on population and employment density, commuting patterns and house construction dates. The two Urban Core classifications (CBD and Inner Ring) generally replicate the pre-World War II environment, when urban population densities were much higher and there was much less automobile use. In contrast, the other three classifications (Earlier Suburbs, Later Suburbs and Exurbs) reflect the substantially lower urban population densities and much greater automobile use (However, even in the Urban Core, automobile use is dominant, while transit accounts for less than one-third of commutes).
Wendell Cox is principal of Demographia, an international public policy and demographics firm. He is a Senior Fellow of the Center for Opportunity Urbanism (US), Senior Fellow for Housing Affordability and Municipal Policy for the Frontier Centre for Public Policy (Canada), and a member of the Board of Advisors of the Center for Demographics and Policy at Chapman University (California). He is co-author of the "Demographia International Housing Affordability Survey" and author of "Demographia World Urban Areas" and "War on the Dream: How Anti-Sprawl Policy Threatens the Quality of Life." He was appointed to three terms on the Los Angeles County Transportation Commission, where he served with the leading city and county leadership as the only non-elected member. He served as a visiting professor at the Conservatoire National des Arts et Metiers, a national university in Paris.
Photograph: Extract from a US Census Bureau population pyramid.
https://www.census.gov/content/dam/Census/newsroom/blogs/2016/06/america...


Florida already got there
This is consistent with growth in Florida. The exurbs are vastly more affordable to our newcomers who are living on a fixed income.
http://www.newgeography.com/content/002631-florida%E2%80%99s-quick-rebou...
Richard T. Reep, AIA, LEED-AP
Adjunct Professor, Rollins College
Architect