
California left-wingers who want to densify cities to make them affordable are getting some push-back from other left-wingers who think density will push low-income people out of neighborhoods. A proposed bill to eliminate zoning in transit-rich areas in order to allow developers to build high-density housing would, say opponents, displace low-income families from neighborhoods with high rental rates in favor of high-income whites who can afford to pay for high-rise housing.
The opponents aren’t wrong. On one hand, increasing housing supply would seem to make housing more affordable. But affordable for whom? With housing prices in some California cities averaging more than $1,000 per square foot, building high-density housing that costs $400 to $500 a square foot would allow people who can afford that to find a place to live. But hardly anyone can afford that.
The problem is that high-density housing–that is, mid-rise and high-rise housing–costs 50 to 68 percent more, per square foot, to build than low-density housing. If California really wants to build housing that is affordable to low-income people, it needs to build more low-density housing. To build that, it needs to open up land that has been off-limits to development because it is outside of urban-growth boundaries.
Denver is making the same mistake. The region has had an urban-growth boundary that has made Denver housing twice as expensive as housing in peer cities such as Albuquerque, Dallas, and Phoenix. Rather than abolish the boundary, Denver is allowing developers to build higher provided they set aside a few units for “affordable housing” — which means charging more for the remaining units to make up for the losses on the affordable ones. That will raise, not lower, overall housing prices because other sellers will see that new units are selling for higher prices.
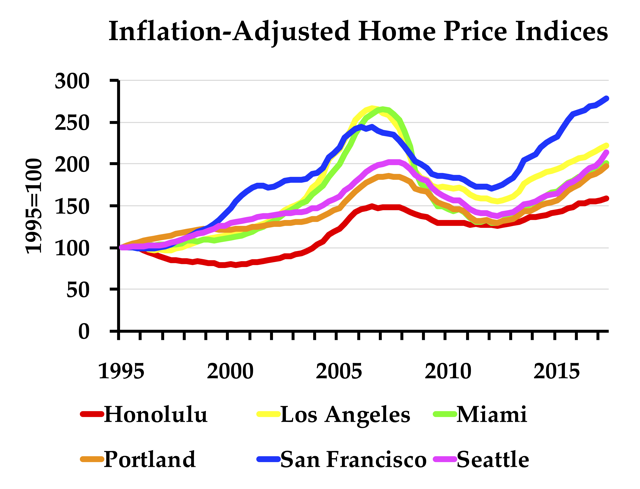
Speaking of housing prices, the Federal Housing Finance Agency has released housing indices by state and metropolitan area through the third quarter of 2017. The Antiplanner has enhanced the files for metropolitan areas and states by adjusting the numbers for inflation and making it easy to make charts like the one above for any six regions or states.
If you haven’t used one of these files before, go to cell AQ72 in the metropolitan areas file and cell BO210 in the states file for instructions on how to change the metropolitan areas or states shown in the charts. In the metro areas file, the inflation-adjusted chart appears around cell AQ40 while the non-inflation-adjusted chart appears around cell AQ3. The states file only has a chart for inflation-adjusted data and it appears around BO180.
This piece first appeared on The Antiplanner.
Randal O’Toole is a senior fellow with the Cato Institute specializing in land use and transportation policy. He has written several books demonstrating the futility of government planning. Prior to working for Cato, he taught environmental economics at Yale, UC Berkeley, and Utah State University.
Photo: Downtown Los Angeles, via first tuesday Journal.


