
Once widely seen in the media as “the next great transit city”, the Los Angeles area’s rapid transit boom was turning to a bust — and well before the Covid19 crisis. As we can see below, transit ridership in greater Los Angeles, the nation’s densest urban region, has been declining for years, and things are not likely to get much better with the impact of the pandemic.
In February of 2019, the Los Angeles County Metropolitan Transportation Authority (Metro) Board of Directors adopted its 28 by 2028 Plan (Plan), a program of 28 major transportation projects to be completed prior to the commencement of the 2028 Los Angeles Summer Olympics. We recently consolidated, updated, revised, and expanded a detailed critique of the Plan that we prepared for the Reason Foundation. In short, Metro has thoroughly failed in its primary responsibility for improving transit utilization in Los Angeles County.
Metro’s four-decade history includes large swings in ridership.
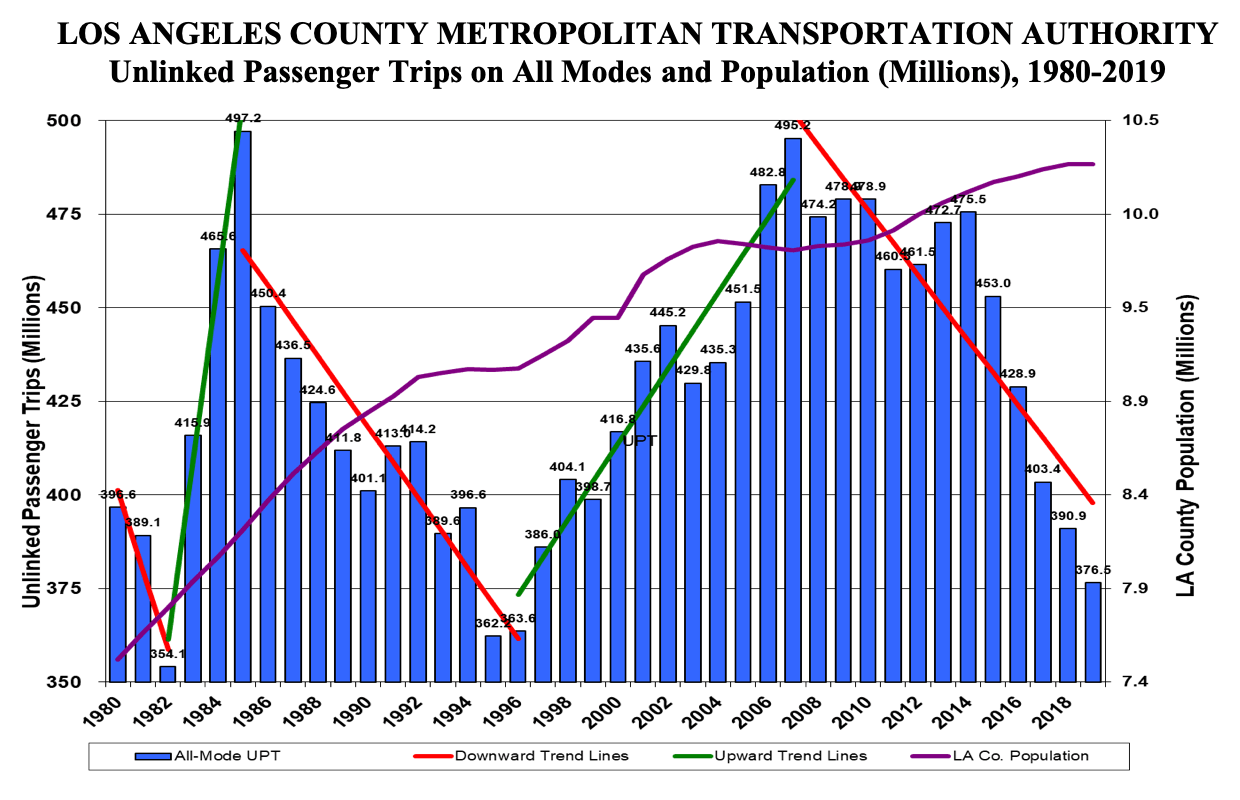
An Unlinked Passenger Trip (UPT) occurs every time a passenger boards a transit vehicle. Linked passenger trips are complete origin-destination trips. A rider that takes a bus to a rail line accounts for two UPT and one linked trip.
For a period of 3 years beginning in 1983, Proposition A, Metro’s first 0.5% sales tax, devoted <20% of revenues to reducing the former 85¢ adult cash bus fare to 50¢. This fare reduction increased UPT on buses by a cumulative total of more than 40% – the highest annual rate of increase for a major U.S. urban transit agency since WWII. As soon as the special three-year, 50¢ fare period ended, Metro immediately shifted funding to rail expansion, reduced bus service, and began allowing the bus fleet to deteriorate. For almost two decades, Metro operated the most overcrowded bus service in the U.S. Fares eventually increased to $1.35. Despite the crowding on buses, total transit ridership tanked.
A Federal lawsuit resulted in a Consent Decree requiring Metro to reduce fares and add bus service, and the downward trend in Metro’s ridership quickly reversed. These requirements were in effect for 11 years, and by 2007, Metro’s ridership had all-but-returned to the 1985 all-time peak. Several new rail lines entered service during this period, but 58% of Metro’s ridership increase occurred on buses – and ~70% of the new rail riders were former bus riders.
After the Consent Decree expired, Metro leapt back to its practice of prioritizing rail construction over delivery of bus service, and, once again, total transit ridership tanked. Metro’s first rail line opened in 1991. Between the 1985 ridership peak and 2019, rail UPT grew from nothing to 102.8 million, while bus ridership dropped by 223.6 million. For every ten rail boardings added, almost 22 bus boardings were lost, for a net loss in UPT of 24%. Matters are worse of late. Since the second peak in 2007, for every ten rail riders added to the system, 68 bus riders were lost. LA County population increased 25% between 1985 and 2019, UPT/capita is down almost 40%.
Transfers occur when riders have to change vehicles. Transfers increase delay and travel uncertainty, and make transit a less attractive travel option. There are 26,000 bus stops in LA County, but only about 93 Metro Rail stations. One result of LA’s conversion from an all-bus transit system to a multimodal bus and rail system is an increase in Metro’s pre-rail transfer rate from ~1.65 unlinked trips per linked trip to a new ratio of more than 2.25:1. Taking this increased transfer rate into account, the 2019 linked trips/capita is down more than 55% from the 1985 peak ridership on the all-bus system.
Metro has concentrated on expanding the rail network, but rail ridership has stopped growing, peaking in 2013. By 2019, rail ridership was down 9%, even as Metro extended the Expo Line to Santa Monica and the Gold Line to Azusa.
Metro was losing ridership in 2020 prior to the arrival of the Coronavirus. Despite no budgeted reductions in boardings, UPT was still down 2% for the first eight months of the fiscal year before falling 35% for March, 2020 relative to March, 2019.
Metro recently reported that ridership is down 70% and that the agency is now operating a reduced-service, “modified Sunday” schedule. The recent Federal CARES Act includes $1.628 billion for the six-county, Southern California Association of Governments (SCAG) region, mostly for LA County. CARES provide for 100% Federal funding of employee costs, including the costs of those employees told to stay home due to lack of work. Metro has announced that its employees will receive pay and benefits while service is reduced.
Things are not likely to improve in the wake of Covid-19 .The public health emergency has hit all US transit operators very hard. Financially, Metro may be somewhat better off than many. Metro has a low farebox recovery ratio compared to the New York or Bay Area Rapid Transit (BART) systems, so a large loss of ridership, while serious, is less of a financial problem for Metro than for these other systems. Metro’s primary source of funds, sales taxes, will be significantly diminished, particularly as residents coping with interrupted wages prioritize food, rent, medical care, and other untaxed expenditures.
Future transit ridership is more difficult to predict as the nation begins a shift to whatever our new normal will be. There is, to date, no peer-reviewed research showing a cause-and-effect link between riding transit and contracting COVID-19, but the case seems obvious, at least to riders. New York City, the U.S. epicenter for Coronavirus cases, accounts for 6% of the US population and over 40% of US transit use. Ridership on the NYC system is down by over 80%. In the Bay Area, BART is down by 94%.
Former transit riders, even the most transit dependent, may be reluctant to return to transit. Transit presents a stark choice between risking their lives and generating enough money for food and other essentials. The less transit dependent riders will notice that traffic congestion is far diminished relative to the status quo ante and likely to stay that way for some time. Gasoline prices have fallen to levels that younger drivers have never seen before and many people and employers have learned the benefits of working-from-home.
Under routine circumstances, Metro ridership has a five-year half-life. That is, on average, half of Metro riders leave after this period, many due to improvements in their finances that make it possible for them to afford a car. Even in a period of financial hardship, our new circumstances will motivate many former transit riders to see if they can afford a car – at a time when an oversupply of used cars is predicted to drive down prices.
But the bigger question — given the financial blow from the pandemic — may be, “What will happen with Metro’s capital program?” Metro’s construction program is very dependent on a high level of sales tax revenues, in part because tax revenues drive Metro’s access to borrowing. A reduction of $1 million in annual sales tax revenues reduces Metro’s bonding capacity over $10 million. The projected loss in sales tax next year will be in the hundreds of millions.
Metro’s 28 by 2028 Plan is irrationally optimistic in multiple ways, and bound to fail within a few years, and that was before the pandemic. In the absence of very substantial new funding from the Federal and/or State governments, Metro’s capital plans will now have to be significantly reduced and delayed. The current crisis requires that the entire role of transit in American urban mobility be thoughtfully reimaged, and whether it wants to or not, Metro is going to have to sort project priorities if it wishes to survive and remain even remotely relevant.
Thomas A. Rubin is transit consultant based in Oakland, and former Chief Financial Officer of the Southern California Rapid Transit District.
James E. Moore is a Professor in the University of Southern California Viterbi School of Engineering and Price School of Public Policy, and director of the Transportation Engineering program.
Photo credit: METRO96 via Wikimedia under CC 3.0 License.


