
This article provides data on COVID-19 fatality rates for the 53 US major metropolitan areas, from the first infection to December 31, 2020.Because so many US major metropolitan areas (over 1,000,000 population) stretch across state lines, the article indicates all of the states each is located in (for example, Philadelphia is in four states, Pennsylvania, New Jersey, Delaware and Maryland).
The data also shows that the metros with the highest fatality rates were in the New York to Boston corridor. The lowest fatality rates generally have higher information technology and white-collar work forces, which are employment segments which may have had the job largest migration to telework during the lockdowns.
The Northeast Corridor
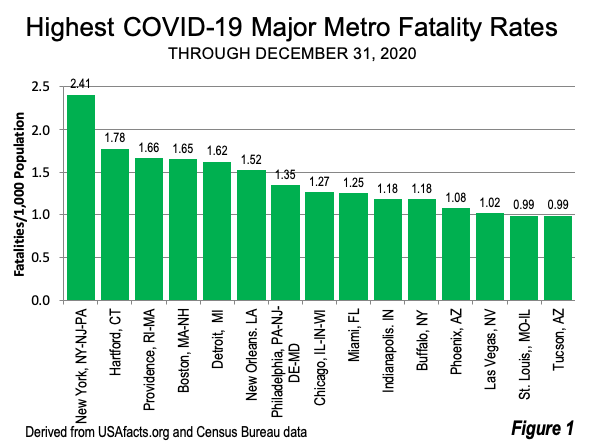
The highest COVID-19 fatality rates among the major metropolitan areas during 2020 were concentrated in the New York to Boston segment of the Northeast Corridor (which stretches from Washington to Boston). The four major metros from New York to Boston had the most deaths per 1,000 residents out of the 53 in the nation.
The highest fatality rate was in the New York, NY-NJ-PA metropolitan area, at 2.475 per 1,000 residents. This is 2.41 times the national rate of 1.027. New York’s fatality rate was far above that of other metropolitan areas. The difference between highest death rate New York and second highest death rate Hartford (below), was by far the largest among the 53 ranked metropolitan areas.
Hartford, CT, midway between New York and Boston, had a rate of 1.824 per 1,000 residents, 1.78 times the national average. Providence, RI-MA (which is also a part of the larger Boston commuting zone, or combined statistical area) had the third highest fatality rate, at 1.709, 1.66 times the national rate. The fourth highest rate was in Boston, MA-NH, at 1.699, 1.65 times the national rate.
Philadelphia, PA-NJ-DE-MD also in the Northeast Corridor, had the seventh highest fatality rate. The other three major metropolitan areas in the Northeast Corridor had considerably lower fatality rates. Baltimore, MD had a fatality rate of 0.907, which was 20th highest. Baltimore’s fatality rate was 12% lower than the national rate, while Washington, DC-VA-MD-WV had a fatality rate of 0.795, which was the 28th highest. Washington’s fatality rate was 23% below the national rate (Figure 1).
Other Higher Fatality Rates
Detroit, MI had the highest fatality rate outside the Northeast Corridor, at 1.665, ranking 5th. New Orleans, LA (6th), Chicago, IL-IN-WI (8th), Miami (9th) and Indianapolis, IN (10th) also were among the 10 major metros with the highest fatality rates.
Lowest Fatality Rates
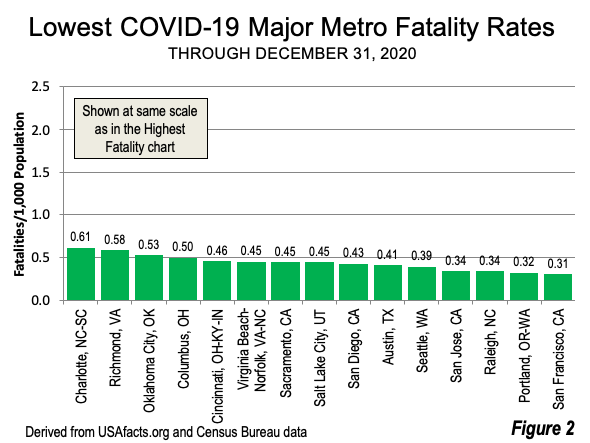
The lowest fatality rates were in San Francisco, CA (0.316), Portland, OR-WA (0.332), Raleigh, NC (0.349), San Jose, CA (0.352), Seattle (0.402), Austin (0.421), San Diego, CA (0.441), Salt Lake City, UT (0.451), Sacramento, CA (0.459) and Virginia Beach-Norfolk (0.464). (Figure 2) Each of these metropolitan areas is below one-half of the national rate. These metros have generally higher telework rates (Figure 2).
New York and San Francisco Differences and Similarities
Overall, the major metropolitan area death rate is roughly equal to that of the nation (Table 1). The range, however, was much greater, with New York’s highest death rate being eight times the fatality rate of lowest San Francisco.
Table 1
IT and White Collar Employment Shares Compared to
10 Lowest COVID Fatality Rates
(through December 31, 2020) Out of 53 Major Metropolitan Areas
| COVID Rank (Low) | Major Metropolitan Area | IT Rank | White Collar Rank |
| 1 | San Francisco, CA | 2 | 3 |
| 2 | Portland, OR-WA | 12 | 15 |
| 3 | Raleigh, NC | 5 | 6 |
| 4 | San Jose, CA | 1 | 1 |
| 5 | Seattle, WA | 4 | 8 |
| 6 | Austin, TX | 7 | 7 |
| 7 | San Diego, CA | 9 | 17 |
| 8 | Salt Lake City, UT | 14 | 27 |
| 9 | Sacramento, CA | 16 | 31 |
| 10 | Virginia Beach-Norfolk, VA-NC | 25 | 35 |
| Derived from USAfacts.org and Census Bureau data | |||
However the New York and San Francisco metro areas have faced a similar situation in being severely locked down in their central business districts, which are very dense. City of San Francisco residential densities reach 160,000 per square mile, while the top residential density is more than 400,000, or 2.5 times as great. The impact of these lockdowns is evidenced by the fact that the longer distance rail systems serving the central business districts are operating at such a low rate relative to normal. As of last week, BART in San Francisco continued to operate at almost 90% below normal on weekdays, while in New York, the Long Island Railroad was running 75% below normal and the Metro-North Railroad (to Connecticut and the Hudson Valley) was 80% below normal.
White Collar Employment
One characteristic shared by the metros with the lowest fatality rates is a high percentage of “computer, engineering and scientific” (information technology [IT]) occupations as a share of total employment. Six of the 10 metropolitan areas with the lowest fatality rates are among the 10 with the greatest share of IT workers in 2019 (based on American Community Survey 2019 data). They are San Jose (#1), San Francisco (#2), Seattle (#4), Raleigh (#5), Austin (#7) and San Diego (#9). In addition, Portland, Salt Lake City and Sacramento rank in the second 10 in IT occupations. The largest tech hubs not among the lowest 10 fatality rates are Washington, DC-VA-MD-WV (3rd largest hub) and Boston (6th largest hub).
Not surprisingly, a similar relationship is occurs in a white collar classification (Management, business, science, and arts occupations), though not quite as strong. Five of the 10 major metros with the lowest COVID-19 fatality rates also rank among the top 10 ratios of white collar workers. The difference is that San Diego is not among the top 10 in white collar workers (ranked 17th), while Salt Lake City and Sacramento are not in the second ten (Table 2).
Overcrowding
While there are many factors that might contribute to differing fatality rates among metropolitan areas, the information technology and white-collar connections are plausible, especially because this sector of the economy has seen the greatest conversion to telework, which has resulted in much greater social distancing in employment.Employment overcrowding is largely eliminated by working from home.
Employment densities reach far greater levels in the United States than population densities. For example, in 2010, the highest employment density census tract in Manhattan (New York) was over 825,000 per square mile (2010). By comparison, Manhattan’s highest residential density census tract was only 200,000 per square mile, less than one- fourth as much. The highest densities are associated with higher exposure densities due to related incidences of overcrowding. The sustainable shift to telework should help to better prepare the nation’s major metropolitan areas from the consequences of future epidemics.
Photograph: New York metropolitan area (principally Queens, Midtown Manhattan and New Jersey suburbs): Highest COVID death rate. (by author).
Wendell Cox is principal of Demographia, an international public policy firm located in the St. Louis metropolitan area. He is a founding senior fellow at the Urban Reform Institute, Houston and a member of the Advisory Board of the Center for Demographics and Policy at Chapman University in Orange, California. He has served as a visiting professor at the Conservatoire National des Arts et Metiers in Paris. His principal interests are economics, poverty alleviation, demographics, urban policy and transport. He is co-author of the annual Demographia International Housing Affordability Survey and author of Demographia World Urban Areas.
Mayor Tom Bradley appointed him to three terms on the Los Angeles County Transportation Commission (1977-1985) and Speaker of the House Newt Gingrich appointed him to the Amtrak Reform Council, to complete the unexpired term of New Jersey Governor Christine Todd Whitman (1999-2002). He is author of War on the Dream: How Anti-Sprawl Policy Threatens the Quality of Life and Toward More Prosperous Cities: A Framing Essay on Urban Areas, Transport, Planning and the Dimensions of Sustainability.
Table 2
COVID-19 DEATH RATES THROUGH DECEMBER 31, 2020
Major Metropolitan Areas (over 1,000,000 Population)
| Rank: High Death Rate | Metropolitan Area | Population | Deaths | Rate per 1,000 | Death Rate Compared to National | Rank: Population |
| 1 | New York, NY-NJ-PA | 19,216,182 | 47,551 | 2.475 | 2.41 | 1 |
| 2 | Hartford, CT | 1,204,877 | 2,198 | 1.824 | 1.78 | 48 |
| 3 | Providence, RI-MA | 1,624,578 | 2,777 | 1.709 | 1.66 | 38 |
| 4 | Boston, MA-NH | 4,873,019 | 8,278 | 1.699 | 1.65 | 11 |
| 5 | Detroit, MI | 4,319,629 | 7,193 | 1.665 | 1.62 | 14 |
| 6 | New Orleans, LA | 1,270,530 | 1,988 | 1.565 | 1.52 | 45 |
| 7 | Philadelphia, PA-NJ-DE-MD | 6,102,434 | 8,463 | 1.387 | 1.35 | 8 |
| 8 | Chicago, IL-IN-WI | 9,458,539 | 12,320 | 1.303 | 1.27 | 3 |
| 9 | Miami, FL | 6,166,488 | 7,930 | 1.286 | 1.25 | 7 |
| 10 | Indianapolis, IN | 2,074,537 | 2,520 | 1.215 | 1.18 | 33 |
| 11 | Buffalo, NY | 1,127,983 | 1,370 | 1.215 | 1.18 | 49 |
| 12 | Phoenix, AZ | 4,948,203 | 5,477 | 1.107 | 1.08 | 10 |
| 13 | Las Vegas, NV | 2,266,715 | 2,379 | 1.050 | 1.02 | 28 |
| 14 | St. Louis, MO-IL | 2,803,228 | 2,849 | 1.016 | 0.99 | 20 |
| 15 | Tucson, AZ | 1,047,279 | 1,064 | 1.016 | 0.99 | 53 |
| 16 | Memphis, TN-MS-AR | 1,346,045 | 1,354 | 1.006 | 0.98 | 43 |
| 17 | Birmingham, AL | 1,090,435 | 1,036 | 0.950 | 0.92 | 50 |
| 18 | Pittsburgh, PA | 2,317,600 | 2,191 | 0.945 | 0.92 | 27 |
| 19 | Milwaukee, WI | 1,575,179 | 1,475 | 0.936 | 0.91 | 39 |
| 20 | Baltimore, MD | 2,800,053 | 2,539 | 0.906 | 0.88 | 21 |
| 21 | Minneapolis-St. Paul, MN-WI | 3,640,043 | 3,292 | 0.904 | 0.88 | 16 |
| 22 | Los Angeles, CA | 13,214,799 | 11,930 | 0.903 | 0.88 | 2 |
| 23 | Denver, CO | 2,967,239 | 2,632 | 0.887 | 0.86 | 19 |
| 24 | Tampa-St. Petersburg, FL | 3,194,831 | 2,774 | 0.868 | 0.85 | 18 |
| 25 | Grand Rapids, MI | 1,077,370 | 923 | 0.857 | 0.83 | 51 |
| 26 | San Antonio, TX | 2,550,960 | 2,169 | 0.850 | 0.83 | 24 |
| 27 | Nashville, TN | 1,934,317 | 1,624 | 0.840 | 0.82 | 36 |
| 28 | Washington, DC-VA-MD-WV | 6,280,487 | 4,993 | 0.795 | 0.77 | 6 |
| 29 | Riverside-San Bernardino, CA | 4,650,631 | 3,393 | 0.730 | 0.71 | 13 |
| 30 | Louisville, KY-IN | 1,265,108 | 921 | 0.728 | 0.71 | 46 |
| 31 | Jacksonville, FL | 1,559,514 | 1,126 | 0.722 | 0.70 | 40 |
| 32 | Rochester, NY | 1,069,644 | 757 | 0.708 | 0.69 | 52 |
| 33 | Kansas City, MO-KS | 2,157,990 | 1,496 | 0.693 | 0.67 | 31 |
| 34 | Atlanta, GA | 6,020,364 | 4,108 | 0.682 | 0.66 | 9 |
| 35 | Houston, TX | 7,066,141 | 4,646 | 0.658 | 0.64 | 5 |
| 36 | Cleveland, OH | 2,048,449 | 1,346 | 0.657 | 0.64 | 34 |
| 37 | Dallas-Fort Worth, TX | 7,573,136 | 4,904 | 0.648 | 0.63 | 4 |
| 38 | Orlando, FL | 2,608,147 | 1,646 | 0.631 | 0.61 | 23 |
| 39 | Charlotte, NC-SC | 2,636,883 | 1,661 | 0.630 | 0.61 | 22 |
| 40 | Richmond, VA | 1,291,900 | 776 | 0.601 | 0.58 | 44 |
| 41 | Oklahoma City, OK | 1,408,950 | 762 | 0.541 | 0.53 | 41 |
| 42 | Columbus, OH | 2,122,271 | 1,089 | 0.513 | 0.50 | 32 |
| 43 | Cincinnati, OH-KY-IN | 2,221,208 | 1,041 | 0.469 | 0.46 | 30 |
| 44 | Virginia Beach-Norfolk, VA-NC | 1,768,901 | 821 | 0.464 | 0.45 | 37 |
| 45 | Sacramento, CA | 2,363,730 | 1,089 | 0.461 | 0.45 | 26 |
| 46 | Salt Lake City, UT | 1,232,696 | 566 | 0.459 | 0.45 | 47 |
| 47 | San Diego, CA | 3,338,330 | 1,472 | 0.441 | 0.43 | 17 |
| 48 | Austin, TX | 2,227,083 | 938 | 0.421 | 0.41 | 29 |
| 49 | Seattle, WA | 3,979,845 | 1,599 | 0.402 | 0.39 | 15 |
| 50 | San Jose, CA | 1,990,660 | 701 | 0.352 | 0.34 | 35 |
| 51 | Raleigh, NC | 1,390,785 | 485 | 0.349 | 0.34 | 42 |
| 52 | Portland, OR-WA | 2,492,412 | 828 | 0.332 | 0.32 | 25 |
| 53 | San Francisco, CA | 4,731,803 | 1,496 | 0.316 | 0.31 | 12 |
| United States | 328,217,032 | 337,241 | 1.027 | 1.00 | ||
| Source: US Census Bureau | ||||||


