
The long-standing aspiration for home ownership has intensified during the pandemic and with the popularity of remote work. For many, it is no longer necessary to live conveniently close to work, as more and more employees are able to reduce the number of commuting days. This new hybrid model has spurred an increase in demand for housing with more space, both within the house and in the yard.
But it is particularly expensive in some states to move up to owned housing from renting. This article uses the latest Census Bureau house price and rental data (from the American Community Survey [ACS] for 2019) to compare moving up costs by state. Because of survey difficulties during the pandemic, new data will not be available until at least Autumn of 2022. The cost of moving up from renting to home ownership can be derived by the variation in the price to rent ratio. The cost of moving up is calculated by state in this article, relative to the national price to rent ratio.
It Starts with Renting
Most households seeking to own their first home are already renting. There are also substantial differences among rents among the states. The highest rents are in Hawaii (median gross rent of $1.651 monthly in 2019) and California ($1,614). The Hawaii rent is 51% above the national median gross rent of $1.097.
It might be thought that these higher rents are compensated for by higher incomes. Median household incomes are higher in Hawaii and California, but not high enough to eliminate the difference. When adjusted for the cost of living (using the Bureau of Economic Analysis Regional Price Parities, which compares rents), both Hawaii and California are about 26% higher than the national median rent. In California, annual rents are about $3,475 higher than the national average, while in Hawaii, annual rents are about $3,400 higher.
But paying these higher rents is just the beginning. In the two most expensive states for rentals, it costs more to move up to ownership and other states are also much more costly than average.
Moving Up to Home Ownership
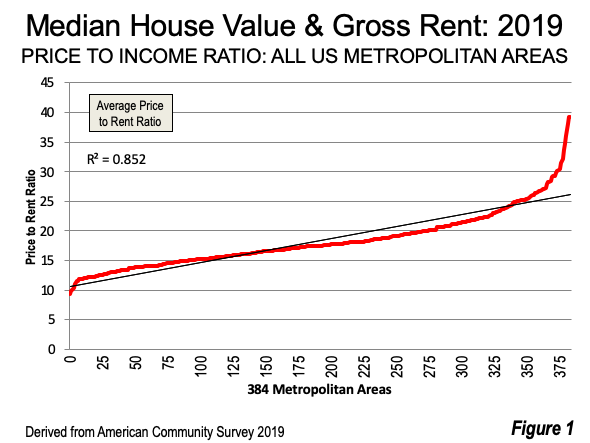
There is a general perception that house prices are higher where rents are higher. That is true. However, median house prices measured at the market (metropolitan area) level, tend to rise much greater rate than rents among the more expensive states (Figure 1).
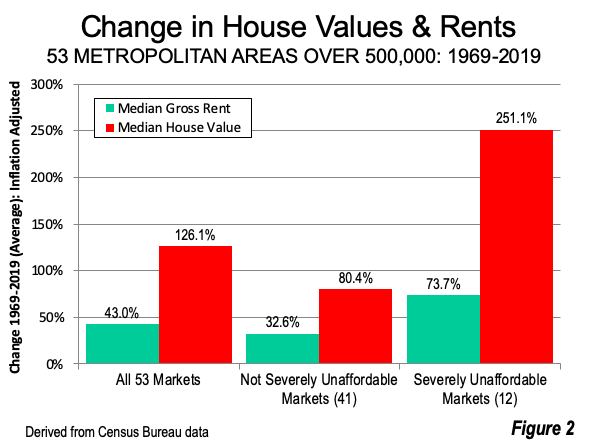
Further house prices have risen much faster over the past half century than rents, especially among the least affordable markets (based on Demographia International Housing Affordability 2021 median multiples [house prices divided by household incomes]).
According to US Census Bureau data, median house prices rose nearly three times that of median gross rents in the half century between 1969 and 2019 (Figure 2). This reflects the unusual rise in the costs of ownership, which economic research has associated with more stringent land and regulation, little of which had been implemented in 1969.
Price to Income Ratios
On average, median house prices (values) are 18.27 times higher than annualized median gross rents. The cost of moving up in Hawaii is 84.9% higher than the national average, with a price to income ratio of 33.78. In California, the cost of moving up is 60.7% as calculated from its price-rent ratio of 29.35.
The third through fifth states in which the cost of moving up are Massachusetts (40.4%), Montana (39.3%) and Utah (37.2%).
Oregon (36.5%), Idaho (32.3%), Colorado (31.5%), Wyoming (30.5%) and Washington (30.1%) have the sixth through 10th highest cost of moving up.
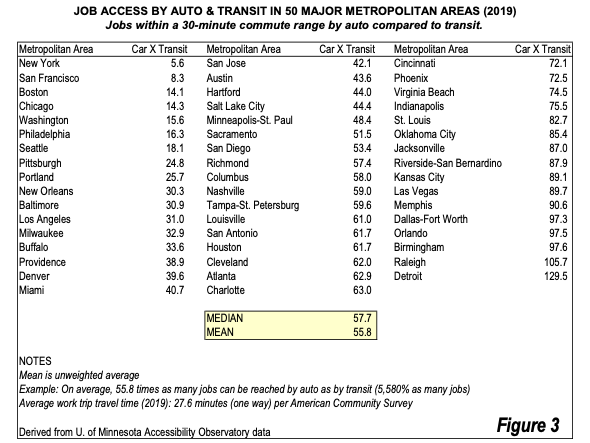
The cost of buying is 24.1% above average in Nevada and 23.8% in Rhode Island. New York (18.0%), North Dakota (16.5%) and New Jersey (15.6%) round out the 15 states with the highest relative cost of moving up (Figure 3).
Median house values are closest to median gross rents in Mississippi (13.7) and West Virginia. Oklahoma, Arkansas and Texas follow. These latter three states are adjacent to one another and are in the West South Central census division (the other state, Louisiana, has the 16th lowest ratio).
Texas, which has experienced strong domestic migration from California in recent years, has a cost of moving up approximately one-half that of California. Meanwhile, tenants in California pay 23% more than they do in Texas, cost of living adjusted.
Note: Metro Costs of Moving Up
Currently, the price to rent ratio among the 384 metropolitan areas varies between about nine and 40, somewhat greater than the state range of 13 to 34 (West Virginia and Hawaii).
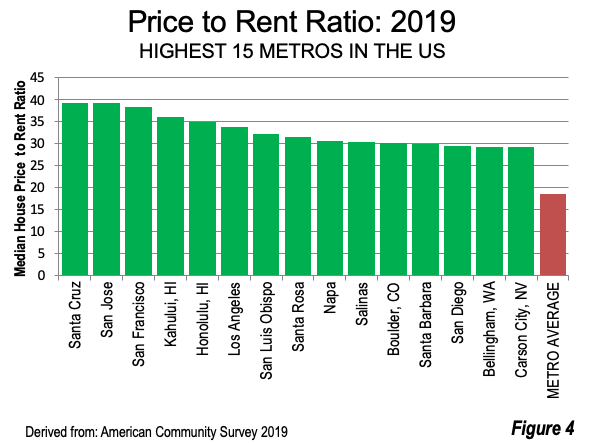
The metros with the highest costs of moving up are San Jose and Santa Cruz, California (adjacent to San Jose), which are tied at 39.12 (Figure 4). San Francisco, also adjacent to San Jose, ranks 2nd, at 38.12. Eight of the ten metros with the highest price to rent ratio are in coastal California. These include San Luis Obispo, CA, Santa Rosa, CA (adjacent to San Francisco), Napa, California (adjacent to San Francisco) and Salinas, CA (adjacent to San Jose).Two of the 10 most costly states for moving up are in Hawaii (Honolulu and Kahalui).
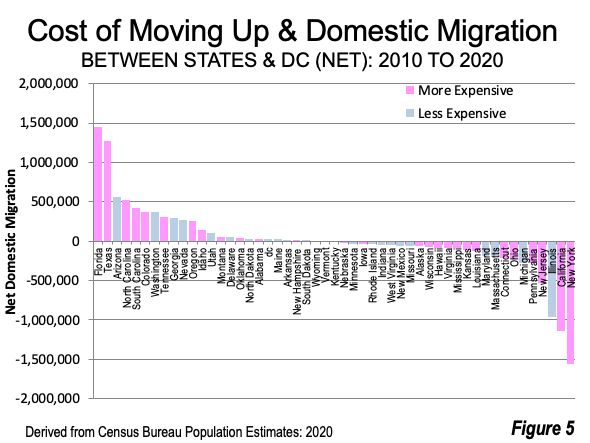
Costs of Moving Up and Domestic Migration
During the 2010-2020 decade, Census Bureau data indicates a strong movement of domestic migrants from states where the cost of moving up is less than the national average — 1.955 million residents. That same number are estimated to have moved from states with a higher cost of moving up (Figure 5). The house price increases that have happened since 2019 are likely to make the cost of moving up even more prohibitive, especially in the most expensive states.
Wendell Cox is principal of Demographia, an international public policy firm located in the St. Louis metropolitan area. He is a founding senior fellow at the Urban Reform Institute, Houston, a Senior Fellow with the Frontier Centre for Public Policy in Winnipeg and a member of the Advisory Board of the Center for Demographics and Policy at Chapman University in Orange, California. He has served as a visiting professor at the Conservatoire National des Arts et Metiers in Paris. His principal interests are economics, poverty alleviation, demographics, urban policy and transport. He is co-author of the annual Demographia International Housing Affordability Survey and author of Demographia World Urban Areas.
Mayor Tom Bradley appointed him to three terms on the Los Angeles County Transportation Commission (1977-1985) and Speaker of the House Newt Gingrich appointed him to the Amtrak Reform Council, to complete the unexpired term of New Jersey Governor Christine Todd Whitman (1999-2002). He is author of War on the Dream: How Anti-Sprawl Policy Threatens the Quality of Life and Toward More Prosperous Cities: A Framing Essay on Urban Areas, Transport, Planning and the Dimensions of Sustainability.
Photo credit: Michael via Wikimedia under CC 2.0 License.


