
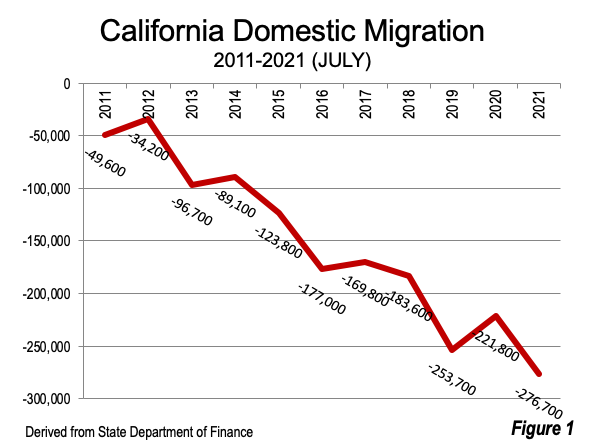
Preliminary county population estimates just released by the state Department of Finance show that California’s population decline is persisting and accelerating. The state lost 173,000 residents over the year ending July 1, 2021. The Department of Finance reports that there were 56,500 Covid related deaths over the same period, which would account for about one-third of the population loss. Net domestic migration dropped to the lowest rate in a decade, down 277,000 --- more than the population of Marin County. Net domestic migration losses were sustained in all years from 2011 to 2021, but rapidly expanded by more than eight times from the lowest point of minus 34,000 by 2021. (Figure 1).
Population
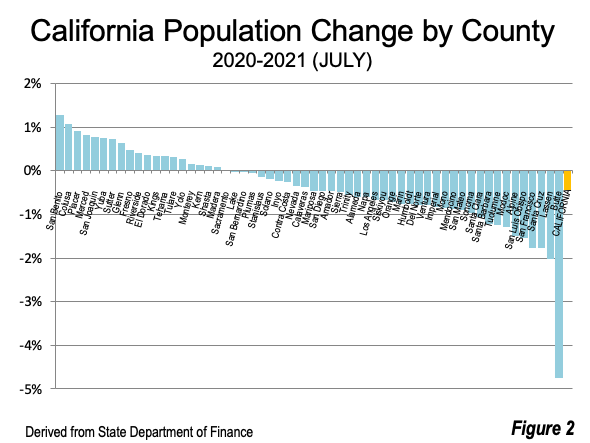
Only 20 of California’s counties added population in the year ended July 1, 2021. The other 38 counties lost population. County population change is shown in Figure 2 and in Table 1, below.
San Benito, Monterey and Riverside counties gained, along with counties in the Central Valley (San Joaquin and Sacramento Valleys). San Benito County, the southern extension of Santa Clara County (San Jose and much of Silicon Valley) grew the fastest (1.27%). Adjacent Monterey County also grew. Salinas is the Monterey County seat and largest city between San Jose and Oxnard along the Route 101 corridor. Riverside County, just beyond the Los Angeles metropolitan area also gained and added the most population, at just over 10,000.
Colusa County in the Sacramento Valley had the second strongest population gain, followed by Placer in metro Sacramento, Merced (recently added to the San Francisco Bay Area combined statistical area by the Office of Management and Budget) and San Joaquin, the latter two in the San Joaquin Valley.
Other Sacramento Valley counties gaining population included Glenn, Shasta, Sutter, Tehama, Yolo, Yuba as well as Sacramento metro counties El Dorado, Yolo and Sacramento.
Other San Joaquin Valley counties gaining population were Fresno, Kern, Kings, Madera, Tulare.
Other Population Growth Highlights
Los Angeles County is estimated to have fallen under 10 million, which a loss of 68,000. However its loss rate, of minus 0.67% was only 37th worst. Adjacent Los Angeles metro county Orange lost 22,000, with a net domestic migration rate of minus 0.72% (ranked 39th).
San Francisco lost 15,400 residents, for net domestic migration rate of minus 1.77% and a ranking of 55th.
Butte (county seat Chico) lost 10,100 and had the largest population loss rate (minus 4.76%). Butte County has been particularly unlucky in having serious wildfires, which led to a drop in the city of Paradise population from 26,200 in the 2010 census to 4,800 in the 2020 census (a loss of 82%). Butte County’s 2021 population of 201,000 is down from 235,000 in 2018, a loss of 14%. Butte also continues to shed domestic migrants at the greatest rate in the state Table 1, below.

Net Domestic Migration
There were 24 counties gaining net domestic migrants, with 34 losing. All but two of the counties gaining net domestic migrants were in the interior. Placer County, in the Sacramento metropolitan area led the state, adding 0.95% of its 2020 population through net domestic migration. San Benito County added 0.76% through domestic migration followed by Tehama, El Dorado and Colusa. There was also positive net domestic migration in Sierra Nevada counties, such as Plumas, Nevada, Sierra and Amador.
As in population growth, Riverside County also led in the number of net domestic migrants, at 6,000. This is 0.25% of its 2020 population, which ranks it at 13th.
The massive net domestic migration losses continue in Butte County (9,500) at a rate of minus 4.51%, which had the highest loss (duplicating its population loss ranking). If Butte County were to sustain this same number of net domestic out migrants annually, the last resident would leave less than 25 years from now, though that probability is nil.
Other Net Domestic Migration Highlights
Los Angeles County lost the largest number of net domestic migrants, at 83,500. However, its minus 0.83 % ranks 43rd, ahead of 15 other counties.
One such county was San Francisco, with a net domestic migration rate of minus 2.01% or 17,500. San Francisco rated 57th, ahead of only Butte County (above). The San Francisco loss rate is more than double the rate of Los Angeles County.
San Diego County lost 28,000 net domestic migrants, for a rate of minus 0.84% and a ranking of 44th.
As in its population trend, Orange County’s net domestic migration trend trailed that of Los Angeles, at minus 0.95%, for a ranking of 46th (a loss of 30,200).
Rays of Hope
As California’s demographic decline intensifies, there remain rays of hope in parts of the state where the cost of living can be afforded by some incoming middle-income households. These are principally in the interior, on the east side of the Coast Range, north of the Transverse Ranges to about Cajon Pass and the Inland Empire (Riverside-San Bernardino metro). Interestingly, some of the strongest domestic migration (in terms of percentage rate) is in the Sacramento Valley, even north of the Sacramento area. Moreover, the positive trends in some Sierra counties may be an indication of remote workers moving to some of the most attractive environments in the nation.
Table 1 (back to top reference)
| CALIFORNIA POPULATION 2020-2021 | ||||||
| By County | ||||||
| Population | ||||||
| County | 2020 | 2021 | Change | Rank | Net Domestic Migration | Rank |
| Alameda | 1,682 | 1,672 | -0.59% | 35 | -1.02% | 48 |
| Alpine | 1 | 1 | -1.50% | 53 | 0.17% | 15 |
| Amador | 41 | 40 | -0.47% | 32 | 0.09% | 21 |
| Butte | 211 | 201 | -4.76% | 58 | -4.51% | 58 |
| Calaveras | 45 | 45 | -0.37% | 29 | 0.12% | 16 |
| Colusa | 22 | 22 | 1.07% | 2 | 0.53% | 5 |
| Contra Costa | 1,167 | 1,164 | -0.25% | 27 | -0.58% | 36 |
| Del Norte | 28 | 28 | -0.78% | 42 | -0.36% | 30 |
| El Dorado | 191 | 192 | 0.37% | 11 | 0.55% | 4 |
| Fresno | 1,009 | 1,014 | 0.48% | 9 | 0.01% | 24 |
| Glenn | 29 | 29 | 0.64% | 8 | 0.40% | 9 |
| Humboldt | 137 | 135 | -0.77% | 41 | -0.61% | 39 |
| Imperial | 179 | 177 | -0.83% | 44 | -1.28% | 49 |
| Inyo | 19 | 19 | -0.24% | 26 | 0.10% | 19 |
| Kern | 907 | 908 | 0.14% | 17 | -0.36% | 28 |
| Kings | 153 | 154 | 0.35% | 12 | -0.37% | 31 |
| Lake | 68 | 68 | -0.02% | 21 | 0.23% | 14 |
| Lassen | 32 | 31 | -2.02% | 57 | -1.94% | 56 |
| Los Angeles | 10,012 | 9,945 | -0.67% | 37 | -0.83% | 43 |
| Madera | 157 | 157 | 0.09% | 19 | -0.36% | 29 |
| Marin | 262 | 260 | -0.76% | 40 | -0.76% | 42 |
| Mariposa | 17 | 17 | -0.46% | 30 | 0.11% | 17 |
| Mendocino | 92 | 91 | -0.87% | 46 | -0.69% | 41 |
| Merced | 281 | 283 | 0.83% | 4 | 0.29% | 12 |
| Modoc | 9 | 9 | -1.28% | 52 | -0.65% | 40 |
| Mono | 13 | 13 | -0.85% | 45 | -1.37% | 51 |
| Monterey | 439 | 440 | 0.16% | 16 | -0.42% | 33 |
| Napa | 138 | 138 | -0.60% | 36 | -0.59% | 38 |
| Nevada | 102 | 102 | -0.35% | 28 | 0.07% | 22 |
| Orange | 3,185 | 3,162 | -0.72% | 39 | -0.95% | 46 |
| Placer | 405 | 409 | 0.92% | 3 | 0.95% | 1 |
| Plumas | 20 | 20 | -0.04% | 23 | 0.45% | 7 |
| Riverside | 2,421 | 2,432 | 0.42% | 10 | 0.25% | 13 |
| Sacramento | 1,586 | 1,586 | 0.02% | 20 | -0.38% | 32 |
| San Benito | 64 | 65 | 1.27% | 1 | 0.76% | 2 |
| San Bernardino | 2,182 | 2,181 | -0.03% | 22 | -0.32% | 27 |
| San Diego | 3,304 | 3,288 | -0.46% | 30 | -0.84% | 44 |
| San Francisco | 871 | 856 | -1.77% | 55 | -2.01% | 57 |
| San Joaquin | 781 | 787 | 0.77% | 5 | 0.41% | 8 |
| San Luis Obispo | 283 | 279 | -1.55% | 54 | -1.47% | 52 |
| San Mateo | 763 | 757 | -0.90% | 47 | -1.34% | 50 |
| Santa Barbara | 449 | 443 | -1.23% | 50 | -1.58% | 54 |
| Santa Clara | 1,934 | 1,913 | -1.06% | 49 | -1.56% | 53 |
| Santa Cruz | 272 | 268 | -1.77% | 55 | -1.82% | 55 |
| Shasta | 182 | 182 | 0.11% | 18 | 0.51% | 6 |
| Sierra | 3 | 3 | -0.49% | 33 | 0.09% | 20 |
| Siskiyou | 44 | 44 | -0.68% | 38 | 0.01% | 23 |
| Solano | 453 | 453 | -0.19% | 25 | -0.48% | 35 |
| Sonoma | 490 | 485 | -0.97% | 48 | -0.96% | 47 |
| Stanislaus | 554 | 553 | -0.15% | 24 | -0.46% | 34 |
| Sutter | 101 | 101 | 0.72% | 7 | 0.30% | 10 |
| Tehama | 66 | 66 | 0.35% | 12 | 0.56% | 3 |
| Trinity | 16 | 16 | -0.55% | 34 | -0.07% | 25 |
| Tulare | 473 | 475 | 0.32% | 14 | -0.26% | 26 |
| Tuolumne | 56 | 55 | -1.24% | 51 | -0.59% | 37 |
| Ventura | 845 | 838 | -0.79% | 43 | -0.95% | 45 |
| Yolo | 217 | 217 | 0.27% | 15 | 0.10% | 18 |
| Yuba | 81 | 82 | 0.76% | 6 | 0.29% | 11 |
| CALIFORNIA | 39,542 | 39,369 | -0.70% | -277 | -0.44% | |
Wendell Cox is principal of Demographia, an international public policy firm located in the St. Louis metropolitan area. He is a founding senior fellow at the Urban Reform Institute, Houston, a Senior Fellow with the Frontier Centre for Public Policy in Winnipeg and a member of the Advisory Board of the Center for Demographics and Policy at Chapman University in Orange, California. He has served as a visiting professor at the Conservatoire National des Arts et Metiers in Paris. His principal interests are economics, poverty alleviation, demographics, urban policy and transport. He is co-author of the annual Demographia International Housing Affordability Survey and author of Demographia World Urban Areas.
Mayor Tom Bradley appointed him to three terms on the Los Angeles County Transportation Commission (1977-1985) and Speaker of the House Newt Gingrich appointed him to the Amtrak Reform Council, to complete the unexpired term of New Jersey Governor Christine Todd Whitman (1999-2002). He is author of War on the Dream: How Anti-Sprawl Policy Threatens the Quality of Life and Toward More Prosperous Cities: A Framing Essay on Urban Areas, Transport, Planning and the Dimensions of Sustainability.
Photo: San Gabriel Mountains in the Transverse Ranges looking toward the Mojave Desert, via Wikimedia under CC 2.0 License.


Domestic Migration Clarification
The California Department of Finance data would reflect the effect of migration between any two US counties. In California, one county would gain and one would use. If a Calif resident moved out, the losing county would indicate a decline, but since the estimates relate to California only, the out-of-state county receiving the migrant would not be reported (and vice versa).
Thank you for the question
Wendell Cox
Demographia
www.demographia.com
causation
Primarily a function of housing-price arbitrage, compounded by aging (dying) in place?
Domestic migration?
Do domestic migration numbers include people moving to/from county to county within California, or does it only include people moving to/from a particular county from out of state?