
According to the US Census Bureau, the year ended July 1, 2021, grew the slowest of any year on record. The driving factor was the Covid-19 pandemic, which increased morbidity and substantially reduced the natural increase of population (births minus deaths).
At the same time, there was a perhaps unprecedented rise in net domestic migration. The Census Bureau characterized it as in some cases “a shift from larger, more populous counties to medium and smaller ones.” This was accelerated by the rise of remote work that kept organizations opened, even during lockdowns, while many households took advantage of the opportunity to obtain more space — inside and out — farther away from workplaces.
This article focuses on trends over the 15-month period from the 2020 Census (April 1, 2020) to the just released July 1, 2021, estimates for the 56 major metropolitan areas (more than 1,000,000 population).
Even with the slower growth, some major metropolitan areas continued to gain population and attract more domestic migrants. At the same time, the losses tended to be more significant, with the lower natural growth rates and increased domestic outmigration in a number of metros.
Population Growth
Among the top 15 metropolitan population percentage gainers, 13 were in the South, with two in the West (Phoenix and Las Vegas). Austin had the strongest population growth (3.0%), followed by Raleigh (2.4%), Phoenix (2.4%) and Jacksonville (2.0%). Nine more metros exceeded growth rates of 1.0%: San Antonio (1.7%), Dallas-Fort Worth (1.6%), Charlotte (1.5%), Tampa-St. Petersburg (1.4%). Las Vegas (1.2%), Houston (1.2%), Riverside-San Bernardino (1.2%), Nashville (1.2%), and Oklahoma City (1.1%). Atlanta and Tulsa grew 0.9% (Figure 1).
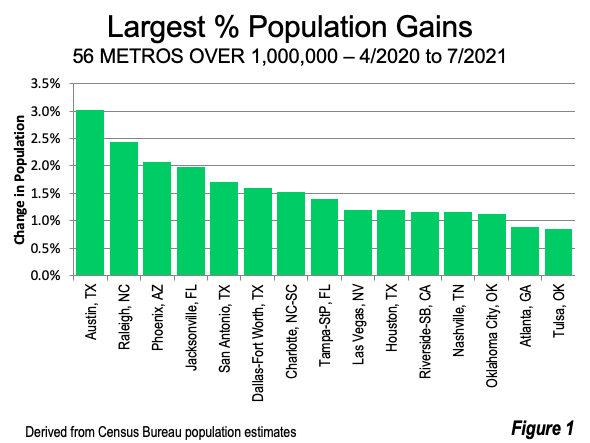
The largest numeric gains were in Dallas-Fort Worth (122,000), Phoenix (100,00) and Houston (85,000).
The largest losses were in the San Francisco Bay area, with metro San Francisco losing the most, (-2.6%) and San Jose second (-2.4%). Four more metros lost more than one percent, including New York (-1.8%), Los Angeles (-1.5%), Honolulu (-1.5%) and Chicago (-1.1%). Losses of from -0.8% to -0.4% occurred in Boston, New Orleans, Miami, Pittsburgh, Detroit, Cleveland, Milwaukee. Rochester and Washington (Figure 2).
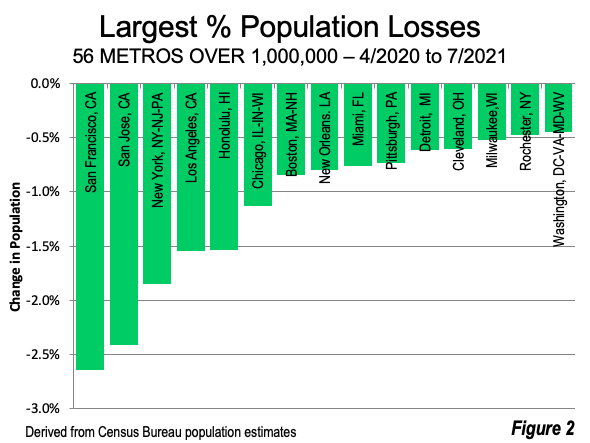
The largest numeric population losses were in New York (-372,000), Los Angeles (-204,000) and San Francisco (-126,000).
Domestic Migration
Domestic migration is measured by net relocation of people between the nation’s counties.
Among the 15 strongest domestic major metropolitan migration gainers, 12 were in the South, with three in the West (Phoenix, Tucson, and Las Vegas). As in population growth, Austin (2.3%) led in net domestic migration. Raleigh and Jacksonville gained 1.9%, followed by Phoenix at 1.8% and Tampa-St. Petersburg. San Antonio gained 1.3% and Charlotte gained 1.2% in net domestic migration. Tucson gained 1.0%. Each of these metros have had a recent history of strong domestic migration gains, with the exception of Tucson, which after small gains and losses, has experienced increases from 2016 to 2021.
Dallas-Fort Worth, Las Vegas, Oklahoma City, Nashville, Riverside-San Bernardino, Tulsa, and Richmond rounded out the top 15 (Figure 3).
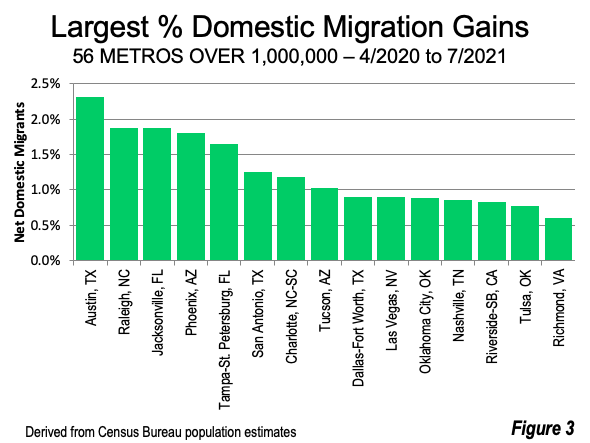
The largest net domestic migration numeric gains over the 15-month period were in Phoenix (87,000), Dallas-Fort Worth (69,000) and Austin (53,000).
The six metros with the largest domestic migration losses were San Jose and San Francisco (-2.9%), New York (-2.2%), Los Angeles and Honolulu (-1.7%) and Chicago (-1.3%), Washington (-1.2%) as well as Boston and Miami (-1.1%). The balance of the 15 metros losing the largest percentage in domestic migration included New Orleans, San Diego Seattle, Milwaukee, Detroit, and Minneapolis-St. Paul. Seattle is particularly significant, as a leading exporter of residents, after its strong attraction of domestic migrants during the 2010s (Figure 4).
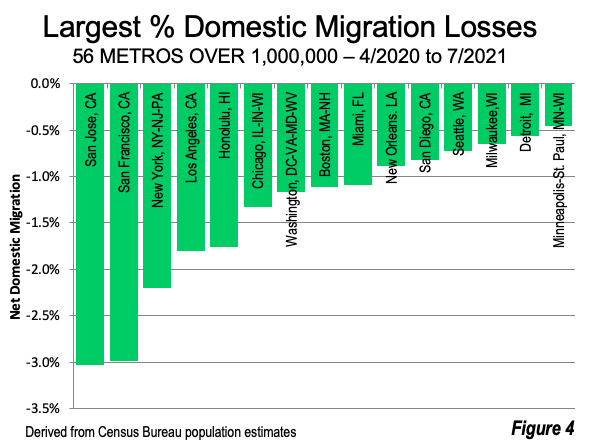
The largest numeric domestic migration losses were in New York (-443,000), Los Angeles (-238,000) and San Francisco (-142,000).
Additional Highlights
Among the major metropolitan areas, the data further reveals (Table):
- Riverside-San Bernardino became the nation’s 12th largest metropolitan area, displacing San Francisco, fell to 13th largest. Riverside-San Bernardino becomes California’s second largest metropolitan area and San Francisco California’s third largest.
- Phoenix enters the top ten among metropolitan areas, having passed Boston. It seems likely that Boston would have ever fallen out of the top ten, for the first time since the initial 1790 US Census.
- Honolulu, which reached 1,000,000 just last year, suffered a large loss, dropping its population down to 1,001,000, and would drop below that figure if losses continue.
- There were signs of life in the Midwest’s “Flyover Country.” Despite the negative trends around the country, Columbus, OH, Indianapolis, IN and Kansas City, MO-KS each posted small gains in both population and net domestic migration.
- Like Seattle, Portland lost both population and domestic migrants, after a long run of gains.
- Denver’s gain was only 3,300 in the last 12 months, after a gain of 5,500 in just the three months from April 1 to July 1, 2020.
There were other significant developments beyond the metropolitan area data, such as:
- The population and domestic migration losses in New York City were unusually high (337,000 and 383,000) over the 15 months. New York City had 43.5% of the state’s population (8,804,000) in April 2020. Since that time, the city accounted for 92.2% of the New York State’s population loss and 94.3% of its net domestic migration.
- Among counties with more than 20,000 residents in the nation, New York County (Manhattan) had the largest percentage population loss since the census, at 6.90%, while San Francisco County (the city of San Francisco) had the second largest loss, at 6.7%.
- The largest overall county population loss was 184,000 in Los Angeles County, with New York County (Manhattan), which has one-fifth as many people, having the second largest loss, at 117,000.
- The city of St. Louis (also a county) fell below 300,000 to 293,000, its lowest population since the 1860s. St. Louis peaked at 857,000 in 1950 and has lost 66% of its residents since that time.
Moving Toward Normal?
The 15-month data from April 2020 to July 2021 corresponds closely with the early pandemic era, with the widespread lockdown strategies generally beginning in March. When the pandemic effects fade, we should see the return of more normal natural population growth.
The one factor, however, that may well have changed is the nature of work and its impact on where people live. Gallup, in describing its continuing examination of employee attitudes toward commuting and working at home suggested that: “We're not returning to the same workplace we left. And employees with the ability to work remotely are largely anticipating a hybrid office environment going forward.” Critically , the increased dispersion of the last 15 months may a maturation of trends already evident late in the 2010s, as domestic migration was already shifting away from larger metro areas (See “Domestic Migration to Dispersion Accelerates [Even Before COVID]).” Many employers are adopting hybrid work models featuring onsite schedules that permit working at home some days. It seems likely that the work-related dispersion will continue, with ultimate impacts still unknown.
Wendell Cox is principal of Demographia, an international public policy firm located in the St. Louis metropolitan area. He is a founding senior fellow at the Urban Reform Institute, Houston, a Senior Fellow with the Frontier Centre for Public Policy in Winnipeg and a member of the Advisory Board of the Center for Demographics and Policy at Chapman University in Orange, California. He has served as a visiting professor at the Conservatoire National des Arts et Metiers in Paris. His principal interests are economics, poverty alleviation, demographics, urban policy and transport. He is co-author of the annual Demographia International Housing Affordability Survey and author of Demographia World Urban Areas.
Mayor Tom Bradley appointed him to three terms on the Los Angeles County Transportation Commission (1977-1985) and Speaker of the House Newt Gingrich appointed him to the Amtrak Reform Council, to complete the unexpired term of New Jersey Governor Christine Todd Whitman (1999-2002). He is author of War on the Dream: How Anti-Sprawl Policy Threatens the Quality of Life and Toward More Prosperous Cities: A Framing Essay on Urban Areas, Transport, Planning and the Dimensions of Sustainability.
Photograph: New York City’s Mid-Town Manhattan (New York County): Largest percentage loss in population of any county: April 1, 2020, Census to July 1, 2021.
Table 1 Back to reference
| Major Metropolitan Areas: Population & Net Domestic Migration | |||||||
| April 1 2020 (2020 Census) to July 1, 2021 | |||||||
| Population in Millions | Net Domestic Migration | ||||||
| Rank | Metropolitan Area | 2020 | 2021 | Change | % | In Millions | % |
| 1 | New York, NY-NJ-PA | 20.140 | 19.768 | (0.372) | -1.8% | (0.443) | -2.2% |
| 2 | Los Angeles, CA | 13.201 | 12.997 | (0.204) | -1.5% | (0.238) | -1.8% |
| 3 | Chicago, IL-IN-WI | 9.619 | 9.510 | (0.109) | -1.1% | (0.128) | -1.3% |
| 4 | Dallas-Fort Worth, TX | 7.637 | 7.760 | 0.122 | 1.6% | 0.069 | 0.9% |
| 5 | Houston, TX | 7.122 | 7.207 | 0.085 | 1.2% | 0.024 | 0.3% |
| 6 | Washington, DC-VA-MD-WV | 6.385 | 6.356 | (0.029) | -0.4% | (0.075) | -1.2% |
| 7 | Philadelphia, PA-NJ-DE-MD | 6.245 | 6.229 | (0.016) | -0.3% | (0.017) | -0.3% |
| 8 | Atlanta, GA | 6.090 | 6.144 | 0.054 | 0.9% | 0.025 | 0.4% |
| 9 | Miami, FL | 6.138 | 6.092 | (0.047) | -0.8% | (0.067) | -1.1% |
| 10 | Phoenix, AZ | 4.846 | 4.946 | 0.100 | 2.1% | 0.087 | 1.8% |
| 11 | Boston, MA-NH | 4.942 | 4.900 | (0.042) | -0.8% | (0.055) | -1.1% |
| 12 | Riverside-San Bernardino, CA | 4.600 | 4.653 | 0.053 | 1.2% | 0.038 | 0.8% |
| 13 | San Francisco, CA | 4.749 | 4.623 | (0.126) | -2.6% | (0.142) | -3.0% |
| 14 | Detroit, MI | 4.392 | 4.365 | (0.027) | -0.6% | (0.025) | -0.6% |
| 15 | Seattle, WA | 4.019 | 4.012 | (0.007) | -0.2% | (0.029) | -0.7% |
| 16 | Minneapolis-St. Paul, MN-WI | 3.690 | 3.691 | 0.000 | 0.0% | (0.017) | -0.5% |
| 17 | San Diego, CA | 3.299 | 3.286 | (0.013) | -0.4% | (0.027) | -0.8% |
| 18 | Tampa-St. Petersburg, FL | 3.175 | 3.220 | 0.044 | 1.4% | 0.052 | 1.6% |
| 19 | Denver, CO | 2.964 | 2.973 | 0.009 | 0.3% | (0.004) | -0.1% |
| 20 | Baltimore, MD | 2.845 | 2.838 | (0.006) | -0.2% | (0.008) | -0.3% |
| 21 | St. Louis,, MO-IL | 2.820 | 2.809 | (0.011) | -0.4% | (0.009) | -0.3% |
| 22 | Charlotte, NC-SC | 2.660 | 2.701 | 0.041 | 1.5% | 0.032 | 1.2% |
| 23 | Orlando, FL | 2.673 | 2.692 | 0.019 | 0.7% | 0.007 | 0.3% |
| 24 | San Antonio, TX | 2.558 | 2.602 | 0.044 | 1.7% | 0.032 | 1.3% |
| 25 | Portland, OR-WA | 2.513 | 2.512 | (0.001) | 0.0% | (0.005) | -0.2% |
| 26 | Sacramento, CA | 2.397 | 2.411 | 0.014 | 0.6% | 0.008 | 0.3% |
| 27 | Pittsburgh, PA | 2.371 | 2.354 | (0.017) | -0.7% | (0.005) | -0.2% |
| 28 | Austin, TX | 2.283 | 2.352 | 0.069 | 3.0% | 0.053 | 2.3% |
| 29 | Las Vegas, NV | 2.265 | 2.292 | 0.027 | 1.2% | 0.020 | 0.9% |
| 30 | Cincinnati, OH-KY-IN | 2.257 | 2.260 | 0.003 | 0.1% | (0.000) | 0.0% |
| 31 | Kansas City, MO-KS | 2.192 | 2.199 | 0.007 | 0.3% | 0.001 | 0.1% |
| 32 | Columbus, OH | 2.139 | 2.151 | 0.012 | 0.6% | 0.003 | 0.1% |
| 33 | Indianapolis. IN | 2.111 | 2.127 | 0.016 | 0.7% | 0.008 | 0.4% |
| 34 | Cleveland, OH | 2.088 | 2.076 | (0.013) | -0.6% | (0.008) | -0.4% |
| 35 | Nashville, TN | 1.990 | 2.012 | 0.023 | 1.2% | 0.017 | 0.9% |
| 36 | San Jose, CA | 2.000 | 1.952 | (0.048) | -2.4% | (0.061) | -3.0% |
| 37 | Virginia Beach-Norfolk, VA-NC | 1.800 | 1.803 | 0.004 | 0.2% | (0.001) | 0.0% |
| 38 | Providence, RI-MA | 1.677 | 1.676 | (0.001) | 0.0% | 0.002 | 0.1% |
| 39 | Jacksonville, FL | 1.606 | 1.638 | 0.032 | 2.0% | 0.030 | 1.9% |
| 40 | Milwaukee,WI | 1.575 | 1.566 | (0.008) | -0.5% | (0.010) | -0.6% |
| 41 | Raleigh, NC | 1.414 | 1.448 | 0.034 | 2.4% | 0.027 | 1.9% |
| 42 | Oklahoma City, OK | 1.426 | 1.442 | 0.016 | 1.1% | 0.013 | 0.9% |
| 43 | Memphis, TN-MS-AR | 1.338 | 1.336 | (0.002) | -0.1% | (0.004) | -0.3% |
| 44 | Richmond, VA | 1.314 | 1.324 | 0.010 | 0.7% | 0.008 | 0.6% |
| 45 | Louisville, KY-IN | 1.285 | 1.285 | (0.001) | -0.1% | (0.000) | 0.0% |
| 46 | Salt Lake City, UT | 1.258 | 1.263 | 0.005 | 0.4% | (0.005) | -0.4% |
| 47 | New Orleans. LA | 1.272 | 1.262 | (0.010) | -0.8% | (0.011) | -0.9% |
| 48 | Hartford, CT | 1.214 | 1.212 | (0.002) | -0.1% | (0.001) | -0.1% |
| 49 | Buffalo, NY | 1.167 | 1.162 | (0.005) | -0.4% | (0.002) | -0.1% |
| 50 | Birmingham, AL | 1.115 | 1.114 | (0.001) | -0.1% | (0.000) | 0.0% |
| 51 | Grand Rapids, MI | 1.088 | 1.092 | 0.004 | 0.4% | 0.000 | 0.0% |
| 52 | Rochester, NY | 1.090 | 1.085 | (0.005) | -0.5% | (0.004) | -0.4% |
| 53 | Tucson, AZ | 1.043 | 1.052 | 0.009 | 0.8% | 0.011 | 1.0% |
| 54 | Tulsa, OK | 1.015 | 1.024 | 0.009 | 0.9% | 0.008 | 0.8% |
| 55 | Fresno, CA | 1.009 | 1.014 | 0.005 | 0.5% | (0.001) | -0.1% |
| 56 | Honolulu, HI | 1.017 | 1.001 | (0.016) | -1.5% | (0.018) | -1.8% |
| Derived from Census Bureau data | |||||||


Too late
for these shifts to be reflected in political reapportionments.