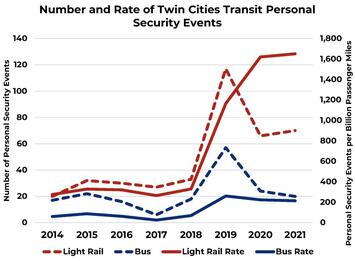
According to federal data, people who decide to step on light rail in the Twin Cities are at more risk for being injured by an assailant than any other light rail system in America. This dramatically higher rate of crime and injury on Metro Transit light rail reveals years of mismanagement. This mismanagement only adds to Metro Transit’s embarrassing delays and cost overruns with the Southwest Light Rail Transit project. With this record of failure, Minnesota lawmakers need to seriously reexamine the future of the Met Council that runs Metro Transit and the ongoing expansion of light rail.
Background
Federal law requires the Federal Transit Administration to maintain a National Transit Database to support planning efforts, make multi-year comparisons and perform trend analyses. Part of this data collection tracks personal security events, which includes assault, homicide, robbery, larceny/theft, motor vehicle theft, rape, and suicide. Because the FTA maintains a uniform method of collecting and reviewing the data, it represents the best source for comparing light rail systems.
Personal security events must meet a certain reporting threshold of injury to be counted. This includes a fatality, a serious injury, or an injury requiring transport from the scene for medical attention. Serious injuries are those that require hospitalization; result in fractures; cause severe hemorrhages or nerve, muscle, or tendon damage; involve an internal organ; or involve second- or third-degree burns. These thresholds effectively limit the data to only major events where victims were injured during a crime. Thus, the number is much smaller than the total amount of crime reported by law enforcement agencies.
Importantly, this focus creates a more apples to apples comparison to determine where crime leads to the most severe injuries—the sort of crime people fear most and want to avoid. The data presented here excludes suicides to further narrow the focus on injuries people suffer when they are victimized by another person committing a crime.
The Data
Overall, this data shows Metro Transit has consistently operated one of the most dangerous light rail systems in the country since 2014. The following figure shows the rate of people injured by an assailant on Metro Transit light rail was substantially higher than the national average from 2014 to 2018. However, this rate soared dramatically higher than any other light rail system in the country in 2019. That year, the rate of people injured per billion passenger miles leapt to 1,164. That represents a 254 percent increase from the previous year. This rocketed the rate to 6.7 times higher than the national average.
Looking at the number and proportion of personal security events occurring on Metro Transit light rail is maybe more shocking. The number of personal security events jumped from 33 in 2018 to 117 in 2019. That’s twice as many as the next closest light rail system. As the next figure shows, that’s also 40 percent of all personal security events that occurred across America’s 22 light rail systems. Putting that in context, Metro Transit accounted for 40 percent of personal security events on light rail while carrying only 4 percent of passenger miles.
Read the rest of this piece at American Experiment.
Peter Nelson is a Senior Policy Fellow at Center of the American Experiment.


