NewGeography.com blogs
New data shows that the downtown areas of both Chicago and Portland (Oregon) are modestly dispersing and losing market share in relation to metropolitan area employment.
Chicago: The Chicago Loop Alliance reports that private sector employment in the Loop, the core of the Chicago downtown area, fell from 338,000 to 275,000 between 2000 and 2010. An additional 30,000 government workers are employed in the Loop, however 2000 data was not provided for the government sector. As a result of the loss, the Loop private sector share of total Chicago metropolitan area employment fell 13 percent, from 7.7 percent in 2000 to 6.7 percent in 2010.
The larger downtown area, including areas to the north (North Michigan Avenue area) and to the south had total private sector employment of 480,000. Chicago had the second largest downtown (central business district) in the nation in 2000, with an employment density of more than 160,000 per square mile and a transit work trip market share of 55 percent, trailing only the Manhattan business district (south of 59 Street) and the Brooklyn central business district).
Portland: The Portland Business Alliance reported that downtown Portland employment had fallen from 86,800 in 2001 to 83,400 in 2009. This represents a four percent market share loss in comparison to the metropolitan area over the period. All of Portland’s growth over the period has been in suburban Clark and Skamania counties in Washington, which added 12,700 jobs, while the Oregon portion of the metropolitan area was losing 4,500 jobs.
In 2000, Portland had the nation’s 22nd largest central business district, and the 12th highest transit work trip market share, at 30 percent (Brooklyn included).
Isn't it curious that an Administration devoted to the principle of multi-modalism is so obsessively determined to promote a single mode of its own preference -- that of high-speed rail? All three governors who rejected the federal HSR grants --- Govs. Walker, Kasich and Scott --- told Sec. LaHood that their states could badly use that money for more urgent needs of fixing roads, bridges and transit systems and, in the case of Gov. Scott, rebuilding Florida's ports in anticipation of the Panama Canal expansion.
Yet Sec. LaHood turned a deaf ear to those requests, insisting that the stimulus money must be spent on high-speed rail --- even though money spent on other modes could have been just as effective in creating jobs. After justly condemning "stove pipe" mentality and modal biases in federal decision making it is ironic to find the Administration ignoring its own principles of modal neutrality in such a blatant manner.
Census data released in the last week indicates confirms the continuing dispersion of population away from the historical core municipalities (central cities) to the suburbs in the 2000 to 2010 decade. The new figures, for Las Vegas, Birmingham and Salt Lake City indicate that a majority of growth occurred in the suburbs in each metropolitan area and that the dispersion of population to the suburbs was greater in the 2000s in each case than in the 1990s.
Las Vegas: The Las Vegas metropolitan area continued to grow strongly, adding 41 percent to its population between 2000 and 2010. This, however, represents a more than halving of the growth rate from the 1990s (86 percent). The metropolitan area population in 2010 was 1,951,000, up from 1,376,000 in 2000.
The core municipality of Las Vegas of grew 22 percent between 2000 and 2010 (from 478,000 to 584,000). The core city of Las Vegas has an overwhelming suburban urban form, having experienced virtually all of its growth in the modern, car oriented era of suburbanization. During the 2000s, the land area of Las Vegas was expanded from 113 square miles to 131.
The suburbs grew 52 percent between 2000 and 2010. The suburbs attracted 82 percent of the metropolitan population growth, up from 65 percent in the 1990s. The suburbs now account for 70 percent of the Las Vegas metropolitan area population.
Birmingham: The Birmingham metropolitan area experienced a decline in growth rate from 10 percent in the 1990s to seven percent in the 2000s. The population increased from 1,052,000 to 1,128,000.
The historical core municipality of Birmingham declined eight percent, from 243,000 to 212,000. This loss of 13 percent is the largest yet recorded for a historical core municipality in a major metropolitan area. Birmingham’s population peaked at 341,000 in 1960. This loss of more than one-third in population between 1960 and 2010 is despite annexations that doubled the size of the city (from 75 to 150 square miles).
The suburbs gained 13 percent between 2000 and 2010 and captured 140 percent of the metropolitan area’s growth (up from 124 percent in the 1990s). The suburbs now account for 81 percent of the metropolitan population.
Salt Lake City: In the Salt Lake City metropolitan area growth declined to 16 percent in the 2000s from 26 percent in the 1990s. The population rose from 969,000 to 1,124,000.
The historical core municipality of Salt Lake City grew three percent (from 182,000 to 186,000). Salt Lake City reached its population peak at 189,000 in 1960. This modest loss occurred while the land area of the city nearly doubled (from 56 square miles to 109).
The suburbs gained 19 percent between 2000 and 2010. The suburbs attracted 97 percent of the metropolitan population growth, which is up from 89 percent in the 1990s.
According to just-released 2010 Census results, the city of St. Louis experienced an unexpected loss in population from 348,000 in 2000 to 319,000 in 2010. This was surprising since the latest population estimate was 357,000 (2009). The new population figure however provided exoneration for the Census Bureau, which had been challenged six separate times during the decade on its city of St. Louis population estimates. The higher 2009 population estimate was the cumulative effect of those six successful challenges. In fact however, without the challenges the city of St. Louis population would have been 311,000, much closer to the final count of 319,000 people.
Among the world's municipalities that have ever achieved 500,000 population non-have lost so much as the city of St. Louis. The new figure of 319,000 people is 63 percent below the 1950 Census peak of 857,000 people. Indeed, the 2010 population is nearly as low as the population in the 1870 census.
Even so, the population loss of the last decade belies the progress that has been made in converting warehouse buildings, office buildings and other disused structures into urban residential areas, especially along Washington Avenue. These developments, among the largest in the United States, however, fell far short of preventing the population loss.
The St. Louis Metropolitan area did much better. In 2010, the metropolitan area had a population of 2,813,000, up from 2,699,000 in 2000, a gain of four percent. The loss in the city was eight percent, while the suburbs gained six percent.
Hong Kong financial chief John Tsang has promised to expand the city's land supply for residential housing, "in response to rising public anger over soaring property prices and repeated warnings of a looming real estate bubble." Channel News Asia's Hong Kong bureau indicated that the move was precipitated by the "sky-high" housing cost that have been drive by insufficient land for development and speculation (which routinely is intensified where demand for housing is permitted to outstrip supply.
Buggle Lau, chief analyst at property firm Midland Holdings told Channel News Asia that he supported the expansion of the land supply "as a way to bring down house prices," adding "It's simple economics - lower demand and higher supply will bring prices down." Channel News Asia noted that Hong Kong had been shown to be the most unaffordable metropolitan market in the recent (7th Annual) Demographia International Housing Affordability Survey.
The Bureau of Economic Analysis yesterday released the 2009 data for metropolitan area GDP. Their headline, “Economic Decline Widespread in 2009,” should come as a surprise to no one.
The BEA focuses on the year on year change. I’d rather look at the full span of the data that’s available, which is now 2001-2009. Here’s a look at percent change in total real metro area GDP during that time period:
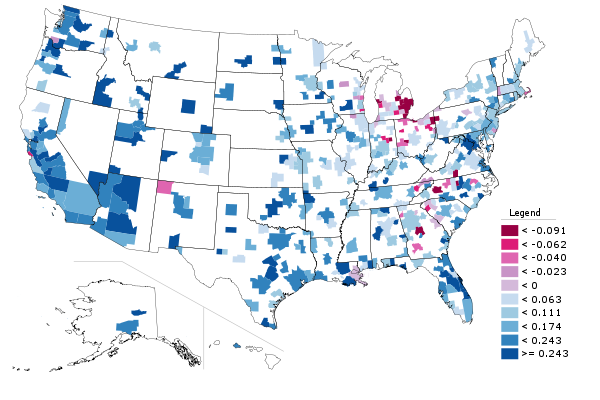
And here are the top ten metro areas over one million in population on this metric:
| Row |
Metro |
2001 |
2009 |
Pct Change |
| 1 |
Portland-Vancouver-Hillsboro, OR-WA |
81,505 |
114,028 |
39.90% |
| 2 |
Oklahoma City, OK |
43,835 |
59,532 |
35.81% |
| 3 |
Austin-Round Rock-San Marcos, TX |
55,466 |
75,136 |
35.46% |
| 4 |
Las Vegas-Paradise, NV |
63,730 |
82,255 |
29.07% |
| 5 |
Orlando-Kissimmee-Sanford, FL |
71,940 |
91,400 |
27.05% |
| 6 |
Phoenix-Mesa-Glendale, AZ |
138,780 |
174,617 |
25.82% |
| 7 |
Washington-Arlington-Alexandria, DC-VA-MD-WV |
294,656 |
368,793 |
25.16% |
| 8 |
San Jose-Sunnyvale-Santa Clara, CA |
117,447 |
146,448 |
24.69% |
| 9 |
Salt Lake City, UT |
48,157 |
59,603 |
23.77% |
| 10 |
San Diego-Carlsbad-San Marcos, CA |
126,875 |
155,850 |
22.84% |
Per capita tells is a little bit different story. Here’s a map of US metro areas for percent change in real GDP per capita:
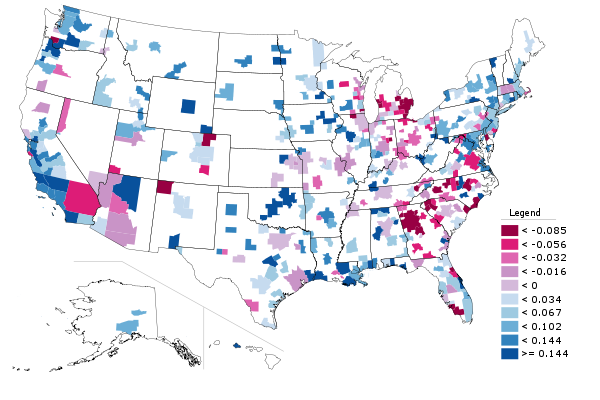
The stunning collapse in real per capita GDP and also the erosion in per capita personal income relative to the nation is one of the key reasons I see Atlanta as a region with far more troubles than is generally assumed.
Here are the top ten large metros again:
| Row |
Metro |
2001 |
2009 |
Pct Change |
| 1 |
Portland-Vancouver-Hillsboro, OR-WA |
41,256 |
50,863 |
23.29% |
| 2 |
Oklahoma City, OK |
39,573 |
48,507 |
22.58% |
| 3 |
San Jose-Sunnyvale-Santa Clara, CA |
67,299 |
79,604 |
18.28% |
| 4 |
San Diego-Carlsbad-San Marcos, CA |
44,252 |
51,035 |
15.33% |
| 5 |
San Francisco-Oakland-Fremont, CA |
63,260 |
72,259 |
14.23% |
| 6 |
Los Angeles-Long Beach-Santa Ana, CA |
46,147 |
52,158 |
13.03% |
| 7 |
Washington-Arlington-Alexandria, DC-VA-MD-WV |
59,801 |
67,344 |
12.61% |
| 8 |
Virginia Beach-Norfolk-Newport News, VA-NC |
37,960 |
42,521 |
12.02% |
| 9 |
Buffalo-Niagara Falls, NY |
31,160 |
34,472 |
10.63% |
| 10 |
New Orleans-Metairie-Kenner, LA |
49,100 |
53,835 |
9.64% |
All I can say is, this data looks great for Portland. That city isn’t perfect to be sure, but on the GDP side of the house, the plan is working beautifully. Contrary to slacker stereotypes, high value work is increasingly being produced there.
Aaron M. Renn is an independent writer on urban affairs based in the Midwest. His writings appear at The Urbanophile.
Just released 2010 Census data indicates that the growth rates of the Seattle, Denver and Portland metropolitan areas fell significantly in the 2000s compared to the 1990s.
Seattle: Seattle metropolitan area population growth fell to 13 percent in the 2000s compared to 19 percent in the 1990s. The metropolitan area population in 2010 was 3,439,000, up from 3,041,000 in 2000. The historical core municipality of Seattle grew eight percent between 2000 and 2010 (from 563,000 to 608,000), while the suburbs grew 14 percent. The suburbs attracted 89 percent of the metropolitan population growth.
Denver: The Denver metropolitan area experienced a decline in growth rate from 32 percent to 17 percent, while the population increased from 2,179,000 to 2,543,000. The historical core municipality of Denver grew eight percent, from 554,000 to 600,000. The suburbs grew 20 percent and accounted for 83 percent of the metropolitan area population growth.
Portland: In the Portland Metropolitan area growth declined to 15 percent from 27 percent, with a population rising from 1,928,000 to 2,226,000. The historical core municipality of Portland grew 10 percent (from 529,002 583,000), while the suburbs gained 17 percent. The suburbs attracted 82 percent of the metropolitan population growth.
Convergence: These slower population growth rates indicate a convergence with the growth rates achieved by middle American metropolitan areas for which data is available. Indianapolis grew 15 percent and Oklahoma City grew 14 percent, more than Seattle and slightly less than Denver and Portland.
Rahm Emanuel has won Chicago’s Mayoral election. He now must confront Chicago’s massive problems. The Chicago Sun-Times is already grim:
Rahm Emanuel’s Round One victory gives him a running start on confronting problems so severe, the painful solutions could seal his fate as a one-termer.
Whether Emanuel can avoid a one-and-done scenario — assuming he even wants to serve more than four years — will largely depend on how he tackles the biggest financial crisis in Chicago history.
The city is literally on the brink of bankruptcy with a structural deficit approaching $1 billion when under-funded employee pensions are factored in.
Mayor Daley borrowed to the hilt, sold off revenue-generating assets and spent most of the money to hold the line on taxes in his last two budgets. The city even borrowed $254 million to cover back pay raises long anticipated for police officers and firefighters.
Last night’s election results could be a preview of Emanuel’s coming conflict with Chicago’s city workforce. Emanuel lost in some important wards where powerful city workers live. The government unions feel Emanuel might be too willing to cut their benefits and pensions. Alderman Ed Burke, Chairman of Chicago’s Finance Committee, will now be Emanuel’s biggest short-term problem (Burke’s 14th Ward didn’t support Emanuel). Does Emanuel have the votes in City Council to remove Alderman Ed Burke from his committee post? It’s too early to tell. Will Emanuel and Burke cut a deal?
The new census numbers showed Chicago with population loss of 200,000 from 2000 to 2010. These Detroit style numbers show Rahm Emanuel will need all the help he can get. Chicago is in decline.
Only two of the world's megacities (metropolitan areas or urban areas with more than 10 million people) have adopted names that are more reflective of their geographical reality than their former core-based names. It is likely that this will spread to other megacities and urban areas as the core jurisdictions that supplied the names for most become even less significant in the dispersing urban area.
The first metropolitan area to make a change was Jakarta which became "Jabotabek," a title derived from the names of four major municipalities in the metropolitan area, Jakarta, Bogor, Tangerang and Bekasi. However, since that name did not include letters from the fifth largest municipality, Depok, the metropolitan area is sometimes called Jabodetabek. But adding a couple of letters for municipalities could lead to an exceedingly long name. For example, a new municipality of South Tangerang was recently created, representing the sixth municipality with nearly 1,000,000 people or more in Jabotabek. Presumably there will be those who will insist on calling the metropolitan area Jabodetabekst, a more Russian than Indonesian sounding name.
Further, a large part of the metropolitan area is not in one of the six larger municipalities and instead is in one of the many smaller jurisdictions. There is thus the potential of the name even longer than the present world record holder, "Taumatawhakatangihangakoauauotamateahaumaitawhitiurehaeaturipuk-
akapikimaungahoronukupokaiwhenuakitanatahu," which is the 105 letter name of a hill in the Hawks Bay area of New Zealand.
The second mega-city with a new name is the Mexico City area. Mexico's national statistics bureau, the Instituto Nacional de Estadística y Geografía (INEGI) has designated the Mexico City metropolitan area as the "Zona Metropolitana del Valle de México," which translates to the Valley of Mexico metropolitan area.
Alternate names for metropolitan areas or urban areas are not unusual. One of the earliest may have been the "Southland," a name apparently given to the Los Angeles area or Southern California many decades ago by the Los Angeles Times. There are Tri-State areas, such as New York and Cincinnati and Seattleites refer to the Puget Sound area. However all of these names have varying definitions depending upon who is using them and none directly corresponds to the boundaries of either an urban area or a metropolitan area.
Perhaps better defined is the Randstad area of the Netherlands, which includes at least the urban areas of Amsterdam, Rotterdam and The Hague. However this area is too large to be considered a single metropolitan area or a single urban area.
Similarly, there is the Pearl River Delta, made up of Hong Kong, Shenzhen, Dongguan, Guangzhou, Foshan, Jiangmen, Zhongshan, Zhuhai and Macau. This area of virtually continuous urbanization is by far the largest in the world, but does not qualify as a metropolitan area or an urban area because each one of the jurisdictions is essentially a separate labor market. Further, despite the fact that Hong Kong and Macau are a part of China, the border controls between Shenzhen and Hong Kong and Zhuhai and Macau make it structurally impossible for those areas to merge into single labor markets.
The Yangtze River Delta is another accurate title for a large area of urbanization. This includes the city/province of Shanghai, and up to 14 city/prefectures, such as Nanjing, Suzhou, Ningbo, Yangzhou and Hangzhou. However, as in the case of the Pearl River Delta each of these represents a separate labor market and urban area.
|