NewGeography.com blogs
IBM has released its annual "Commuter Pain Index," which ranks traffic congestion in 20 metropolitan areas around the world. According to IBM, the Commuter Pain Index includes 10 issues: "1) commuting time, 2) time stuck in traffic, agreement that: 3) price of gas is already too high, 4) traffic has gotten worse, 5) start-stop traffic is a problem, 6) driving causes stress, 7) driving causes anger, 8) traffic affects work, 9) traffic so bad driving stopped, and 10) decided not to make trip due to traffic."
Each metropolitan area is given a score between 0 and 100, with the highest score indicating the worst traffic congestion (See Table).
| IBM Commuter Pain Index: 2010 |
| Metropolitan Areas Ranked by Worst Traffic Congestion |
|
|
|
| Rank |
Metropolitan Area |
Score (Worst to Best) |
| 1 |
Beijing |
99 |
| 1 |
Mexico City |
99 |
| 3 |
Johannesburg |
97 |
| 4 |
Moscow |
84 |
| 5 |
Delhi |
81 |
| 6 |
Sao Paulo |
75 |
| 7 |
Milan |
52 |
| 8 |
Buenos Aires |
50 |
| 9 |
Madrid |
48 |
| 10 |
London |
36 |
| 10 |
Paris |
36 |
| 12 |
Toronto |
32 |
| 13 |
Amsterdam |
25 |
| 13 |
Los Angeles |
25 |
| 15 |
Berlin |
24 |
| 16 |
Montreal |
23 |
| 17 |
New York |
19 |
| 18 |
Melbourne |
17 |
| 18 |
Houston |
17 |
| 20 |
Stockholm |
15 |
Favorable Urban Planning Characteristics Associated with Intense Traffic Congestion: The worst traffic congestion was recorded in the developing world metropolitan areas of Beijing, Mexico City, Johannesburg, Moscow, Delhi and Sao Paulo. In many ways, these metropolitan areas exhibit characteristics most admired by current urban planning principles. Automobile ownership and per capita driving is low. Transit carries at least 40% of all travel in each of the metropolitan areas. Yet traffic is intense. This is due to another urban planning "success," objective, high population densities. Higher population densities are inevitably associated with greater traffic congestion (and more intense local air pollution), whether in the United States or internationally. All six of these metropolitan areas scored 75 or above, where a score of 100 would be the worst possible congestion.
The next five metropolitan areas have accomplished nearly as much from an urban planning perspective. Milan, Buenos Aires, Madrid, London and Paris all achieve more than 20% transit market shares, and their higher urban densities also lead to greater traffic congestion. Each scores between 35 and 52.
Traffic congestion is less in the next group, which includes Toronto, Los Angeles, Berlin, Amsterdam and Montreal. With the exception of Berlin, transit market shares are less, though the urban densities in all are above average US, Canadian and Australian levels. Amsterdam, the smallest metropolitan area among the 20, scores surprisingly poorly, since smaller urban areas are generally associated with lower levels of traffic congestion.
The Least Congested Metropolitan Areas: Four metropolitan areas scored under 20, achieving the most favorable traffic congestion ratings. New York scores 19, with its somewhat lower density (the New York urban density is less than that of San Jose). Even lower density Melbourne and Houston score 17, tying for the second best traffic conditions. Stockholm achieves the best traffic congestion score, at 15, despite its comparatively high density. Stockholm is probably aided by its modest size which is similar to that of Orlando (Florida).
The Houston Advantage: Perhaps the biggest surprise is Houston's favorable traffic congestion ranking.
- Houston has the lowest urban density of the 20 metropolitan areas.
- Houston has the lowest transit market share, by far, at only 1%.
- Houston also has the highest per capita automobile use among the IBM metropolitan areas.
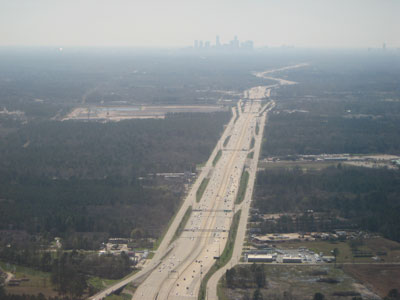 Yet Houston scored better than any metropolitan area on the list except for much smaller Stockholm. As late as 1985, Houston had the worst traffic congestion in the United States, according to the annual rankings of the Texas Transportation Institute. Public officials, perhaps none more than Texas Highway Commission Chair and later Mayor Bob Lanier led efforts to improve Houston's road capacity, despite explosive population growth. Their initiatives paid off. By 1998, Houston had improved to 16th in traffic congestion in the United States. The population growth has been incessant, so much so that Houston has added more new residents since 1985 than live in Stockholm and more than half as many as live in Melbourne. While Houston had slipped to 11th in traffic congestion by 2007, the recent opening of a widened Katy Freeway and other improvements should keep the traffic moving in Houston better than in virtually all of the world's other large metropolitan areas. Yet Houston scored better than any metropolitan area on the list except for much smaller Stockholm. As late as 1985, Houston had the worst traffic congestion in the United States, according to the annual rankings of the Texas Transportation Institute. Public officials, perhaps none more than Texas Highway Commission Chair and later Mayor Bob Lanier led efforts to improve Houston's road capacity, despite explosive population growth. Their initiatives paid off. By 1998, Houston had improved to 16th in traffic congestion in the United States. The population growth has been incessant, so much so that Houston has added more new residents since 1985 than live in Stockholm and more than half as many as live in Melbourne. While Houston had slipped to 11th in traffic congestion by 2007, the recent opening of a widened Katy Freeway and other improvements should keep the traffic moving in Houston better than in virtually all of the world's other large metropolitan areas.
Photo: Freeway in Houston
A just-released report by the Institute of Transportation Studies at the University of California-Berkeley finds that the ridership projections prepared by Cambridge Systematics (CS) for the California high speed rail system are "not reliable."
Authors Samer Madanat (director of ITS-Berkeley and a professor of civil and environmental engineering), Mark Hanson (UC-Berkeley professor of civil and environmental engineering) and David Brownstown (chair of the Economics Department at UC-Irvine) essentially reported that the projections had such large error margins that the system could either lose a lot of money or make a lot of money:
... the combination of problems in the development phase and subsequent changes made to model parameters in the validation phase implies that the forecasts of high speed rail demand-and hence of the profitability of the proposed high speed rail system-have very large error bounds. These bounds, which were not quantified by CS, may be large enough to include the possibility that the California HSR may achieve healthy profits and the possibility that it may incur significant revenue shortfalls.
 Biased High Speed Rail Projections: Given the overwhelming history of upwardly biased ridership and revenue projections in major transport projects, it seems far more likely that reducing the margins of error would produce projections with much smaller ridership numbers and major financial losses. Major research by Oxford University professor Bent Flyvbjerg, Nils Bruzelius (a Swedish transport consultant) and Werner Rottenberg (University of Karlsruhe and former president of the World Conference on Transport Research) covering 80 years of infrastructure projects found routine over-estimation of ridership and revenue (Megaprojects and Risk: An Anatomy of Ambition Biased High Speed Rail Projections: Given the overwhelming history of upwardly biased ridership and revenue projections in major transport projects, it seems far more likely that reducing the margins of error would produce projections with much smaller ridership numbers and major financial losses. Major research by Oxford University professor Bent Flyvbjerg, Nils Bruzelius (a Swedish transport consultant) and Werner Rottenberg (University of Karlsruhe and former president of the World Conference on Transport Research) covering 80 years of infrastructure projects found routine over-estimation of ridership and revenue (Megaprojects and Risk: An Anatomy of Ambition ). The evidence is so condemning that Dr. Flyvbjerg has referred to the planning processes for such projects as consisting of "strategic misrepresentation" and "lying" (his words) to advance projects that might not otherwise be implemented. ). The evidence is so condemning that Dr. Flyvbjerg has referred to the planning processes for such projects as consisting of "strategic misrepresentation" and "lying" (his words) to advance projects that might not otherwise be implemented.
Broad Concern about the Reliability of California High Speed Rail Projections: The University of California report joins other reports that have questioning the veracity of the Cambridge Systematics projections. During the run-up to the 2008 statewide bond issue, the California Senate Transportation and Housing Committee, chaired by Senator Alan Lowenthal (D-Long Beach) indicated concerns. Illustrating continuing concerns, the committee commissioned the University of California study.
Doubts have been expressed by the California Legislative Analyst and the California State Auditor. The Reason Foundation Due Diligence Report, authored by Joseph Vranich and me in 2008 estimated the ridership projections to be at least 100% high (see High Speed Rail: Untimely Extravagance presented at the Heritage Foundation last week in Washington).
Investment Grade Projections Far Lower: The Cambridge Systematics ridership projections publicized that were used in the statewide bond election were more than 150% above the "investment grade" projections that had been produced by Charles Rivers Associates for the California High Speed Rail Authority a decade ago. Even "investment grade" projections can be high, as the recent bond default and bankruptcy of the Las Vegas Monorail indicates. In that case the "investment grade" ridership projections were 150% above the actual achieved average, nonetheless bond holders lost their investments. (Our 2000 report accurately projected the Monorail ridership).
Undermining GHG Emissions Reduction Claims: Meanwhile, the California high speed rail proposal has come under criticism with respect to its environmental claims. The high speed rail line has been promoted as a means for reducing greenhouse gas (GHG) emissions in the state. Yet another recently released University of California report indicates that it could take as long as 71 years to save enough GHG emissions by attracting airline passengers and drivers to cancel out the emissions produced in constructing the project. More defensible ridership projections could lengthen this period considerably.
Response to Criticism: The body of the University of California high speed rail study is 10 pages, followed by approximately 40 pages of comments and response by Cambridge Systematics and a letter from the California High Speed Rail Authority requesting that the University of California authors to consider the comments. This review is performed by the University of California authors, as they reject virtually all Cambridge Systematics criticisms in the final four pages of the report.
Photograph: Cover of Megaprojects and Risk: An Anatomy of Ambition
The Bureau of the Census has updated its city (municipality or local government area) population estimates for 2009. Predictably, anti-suburban interests saw more indication of the elusive (read non-existent) exodus from the suburbs to the central cities. One analyst even suggested that a "high quality" of life in one central city (Washington, DC) might have kept people from moving to the suburbs. In fact, since 2000, nearly 40,000 people (domestic migrants) have moved out of the city of Washington and in the last year, the city gained 4,500 residents while the suburbs gained 13,700.
In contrast, Buffalo News reporter Jack Ray looked at the data and noted that some cities in that metropolitan area were growing rather quickly, while others were losing population. Generally, he found that outer suburban communities were growing more quickly. Ray's analysis was reflective of trends around the nation.
There are nearly 20,000 incorporated cities, towns and villages in the United States. Population trends in these cities show that urban areas are growing most strongly on their suburban fringes or even in their exurbs. For example, two-thirds of the fastest growing 100 municipalities in the nation were suburbs or exurbs in the nation's major metropolitan areas (those with more than 1,000,000 population). The other third were all municipalities in smaller metropolitan areas or outside metropolitan areas.
The extent of this growth on the edge is illustrated by an examination of the nation's municipalities of 25,000 or greater population that grew more than 25% between 2000 and 2009.
- Among the 89 municipalities that grew 50% or more, 59 were in major metropolitan areas and all were suburbs (nearly all near the urban fringe) or exurbs. The total population growth among these suburbs and exurbs was 2.2 million from 2000 to 2009, for an average growth rate of 91%. These major metropolitan suburbs and exurbs grew 1.8 million, while the municipalities outside the major metropolitan areas added 400,000.
- Among the 119 municipalities that grew between 25% and 50%, 69 were in major metropolitan areas. This included 67 suburbs and exurbs. It also included 2 central cities, Raleigh (39%) and Atlanta (28%). These major metropolitan area suburbs and exurbs gained 1.7 million residents, while the two central cities gained a total of 200,000. The municipalities outside the major metropolitan areas grew 1,000,000.
 Combined, the fastest growing suburbs and exurbs with more than 25,000 population grew more than 3.5 million, while the municipalities outside the major metropolitan areas grew 1.5 million, for a combined growth of more than 5.0 million. The smaller high growth municipalities (under 25,000), nearly 1,200 of them, both major metropolitan and outside, grew another 2.5 million. Combined, the fastest growing suburbs and exurbs with more than 25,000 population grew more than 3.5 million, while the municipalities outside the major metropolitan areas grew 1.5 million, for a combined growth of more than 5.0 million. The smaller high growth municipalities (under 25,000), nearly 1,200 of them, both major metropolitan and outside, grew another 2.5 million.
The fastest growing municipalities, excluding the two central cities of Raleigh and Atlanta, accounted for nearly one-third of the nation’s growth between 2000 and 20009.
Most of the fast growing suburbs and exurbs have names that are simply not recognizable. Yet, a half-dozen added nearly as many or more new residents than all of the 20-plus central cities combined in the major metropolitan areas that do not have large swaths of suburbanization inside their borders. These include such places as Phoenix suburb, Surprise, Dallas-Fort Worth suburb Frisco and Riverside-San Bernardino suburb Beaumont.
In Crabgrass Frontier: The Suburbanization of the United States , Kenneth Jackson noted that central Philadelphia began losing population in the early 19th century. The dispersion of America continues. , Kenneth Jackson noted that central Philadelphia began losing population in the early 19th century. The dispersion of America continues.
Photograph: Exurbs of New York: Pike County, Pennsylvania
Bloomberg Business Week reports that the Russian government wants to move urban residents from their "cramped" high rise apartments to new suburban developments. Single family houses would be built in joint ventures with private developers. Present plans are to develop 2.5 million acres of suburban homes. This is a very large program. At Los Angeles densities, this amount of land would be sufficient to house about 28,000,000 people, roughly double the present population of the Moscow urban area.
 As occurred before in the United States, expanding suburban home ownership could generate a democratization of prosperity that brings far better living conditions to middle income households. Already, more affluent households have built European and American style detached houses outside Moscow's 8-lane ring road (see photograph). As occurred before in the United States, expanding suburban home ownership could generate a democratization of prosperity that brings far better living conditions to middle income households. Already, more affluent households have built European and American style detached houses outside Moscow's 8-lane ring road (see photograph).
Photograph: New detached housing, northern Moscow suburbs (Veshki).
Andrew Batston of The Wall Street Journal writes of China's decentralization, with the growing employment in interior urban areas. Until the last decade, most of China's spectacular urban population and employment growth had occurred on the East Coast, especially in the world's largest megaregions of the Pearl River Delta (Hong Kong-Shenzhen-Dongguan-Guangzhou-Foshan-Jiangmin-Zhongshan-Zhuhai-Macao), the Yangtze Delta (Ningbo-Shaoxing-Hangzhou-Shanghai-Suzhou-Wuxi-Changzhou-Nangjing) and Beijing-Tianjin. Millions of migrant workers had traveled to the East Coast from the interior to take jobs paying far more than they could earn at home.
But that has changed. Industrial production and jobs have expanded substantially in the interior, making it possible for people to take jobs closer to home, in Chongqing, Chengdu, Xian, Changsha, Wuhan, Shenyang, Taiyuan and many more urban areas. This is a fortuitous development, because the mega-regions are already sufficiently populated and could have well grown far larger if the interior development had not taken place.
However, jobs have become more plentiful in the interior. China's growing US interstate standard expressway (freeway) system has been an important contributor to this development. Like the US system, there are no grade crossings and all roadways have at least two lanes of traffic in each direction.
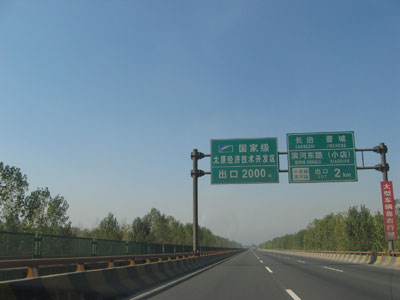 Now, a number of interior urban areas are now within a day's truck drive of the East Coast ports and those that are not are within two days. According to China Daily, the 65,000 kilometers (over 40,000 miles) of the national expressway system is open. This does not include extensive provincially administered systems, such as in Beijing, where four full freeway ring roads are open and a fifth is at least half complete (Beijing has six ring roads, but the first is not a freeway). Shanghai has an extensive locally administered freeway system, as do some other urban areas. Now, a number of interior urban areas are now within a day's truck drive of the East Coast ports and those that are not are within two days. According to China Daily, the 65,000 kilometers (over 40,000 miles) of the national expressway system is open. This does not include extensive provincially administered systems, such as in Beijing, where four full freeway ring roads are open and a fifth is at least half complete (Beijing has six ring roads, but the first is not a freeway). Shanghai has an extensive locally administered freeway system, as do some other urban areas.
By comparison, the US interstate system is approximately 46,000 miles (this excludes 1,000 miles of 2-lane interstate designated conventional highway in Alaska), and a total of 57,000 miles including non-interstate freeways. China is expected to displace the United States in freeway mileage by the end of the decade, when plans call for more than 60,000 miles.
Photograph: National Expressway Route G-040 near Taiyuan, Shanxi
|


