NewGeography.com blogs
For years, some provincial governments in Canada have been either forcing municipal amalgamations or offering incentives for municipalities to merge. This has included municipalities from the largest (Toronto), which was forced into a merger over voter disapproval in 1998 in an advisory election to rural municipalities with fewer than 1,000 in Manitoba, forced to merge by the recently defeated provincial government.
A heated debate has ensued for decades over the issue. Those who believe amalgamations are beneficial claim that costs will drop along with taxes. They claim amalgamations reduce duplication of services. Those who believe that amalgamations tend to be harmful (in most situations, this writer), note that merging the cost structures and political cultures of even adjacent municipalities is likely to raise costs and taxes and note that the duplication of services claim ignores the fact that municipalities have exclusive service areas that preclude such a result.
Besides the disagreements over the quantitative evidence, the local opponents invariably rely on their own interest in keeping government close to home, not believing that bigger government routinely produces greater efficiencies.
The pressure to amalgamate continues in Canada. Recently, six Pictou County, Nova Scotia municipalities began to consider amalgamating. Two dropped out, but the remaining four took advantage of a provincial government program to study amalgamation and then place the question before voters.
The province offered $27 million for infrastructure costs, operating costs and transitional costs, in the event that the amalgamation took place. On May 28, the voters soundly rejected the amalgamation, by a nearly two to one margin. Residents in New Glasgow supported the amalgamation strongly, residents in Pictou narrowly defeated it, while residents of Stellarton and the municipality of Pictou County opposed the measure by three to one margins. According to The News, only four wards or districts approved the plan out of the 21 in the four municipalities. The Newsarticle includes a detailed chronology of the events leading up to the rejection.
According to CTV News, The Nova Scotia Utility and Review Board had projected the merger would produce annual savings of $500,000 annually, which pales by comparison to more than 50 times higher provincial offer of $27 million as an incentive to amalgamate. Further, as has been shown in Toronto and elsewhere, higher costs can result, even where substantial savings have been projected.
Earlier this month (May 9, 2016) the Orange County (California) Grand Jury issued a report entitled: “Light Rail: Is Orange County on the Right Track,” which is on the Grand Jury website here. The report largely concludes that it is not and that there is a need for a light rail system in Orange County. On page 7, the 2016 Grand Jury report says: “No Grand Jury has reported on development of light rail systems in Orange County.”
In fact, there was a previous report, at: http://www.ocgrandjury.org/pdfs/GJLtRail.pdf, which is a 1999 report of the Orange County Grand Jury entitled: “Orange County Transportation Authority and Light Rail Planning.” Both the 1999 and 2016 reports are on the Orange County Grand Jury website as of May 25, 2016. The 1999 report reached fundamentally different conclusions than the 2016 report. Obviously, the 2016 report makes no attempt to reconcile its findings or analysis with the 1999 report.
Inappropriate Density Comparison
There are additional problems with the 2016 Grand Jury Report. In making the case for light rail in Orange County, the 2016 Grand Jury put considerable emphasis on the fact that Orange County’s population density is higher than that of Los Angeles County. The reason for Orange County’s population density advantage is the fact that much of Los Angeles County is in the largely undevelopable Transverse Ranges (including the San Gabriel Mountains), with a considerable amount of rural (not urban) desert. The difference is that Orange County’s land area is approximately two-thirds urban, while Los Angeles County’s land area is about one-third urban. This renders the overall density comparison for urban transportation planning meaningless.
Indeed, the urban density of Los Angeles County is substantially higher than that of Orange County. According to the United States Census Bureau, the population density of the urban areas in Los Angeles County was 6,859 per square mile in 2010, well above Orange County’s 5,738. Los Angeles County’s densest census tract is nearly 2.5 times the density of any census tract in Orange County.
Transit is About Downtown
Even so, urban rail ridership bears little relationship to overall urban population density (otherwise the San Jose urban area would be a better environment for rail than the New York urban area). In 2010, San Jose’s density was about 5,820, while New York’s was 5,319 (Los Angeles was 6,999, including the most dense parts of Los Angeles and Orange County and part of San Bernardino County).
One of the most important keys to transit ridership is the concentration of work destinations in a dense central business district (CBD), to which nearly all high capacity and frequent transit services converge. In the United States, 55 percent of all transit commuting destinations are in the six largest municipalities (such as the city of New York or the city of San Francisco, as opposed to metropolitan areas) with the largest central business districts. This is dominated by New York with about 2,000,000 employees in its CBD. On the other hand, San Jose has one of the smallest central business districts of any major metropolitan area and a correspondingly smaller transit market share than the national average. Orange County, with an urban form far more like San Jose than New York or San Francisco, has little potential to materially increase transit ridership with light rail.
The record of new urban rail in the United States is less than stellar, evaluated on the most important metric. Generally, new urban rail has resulted in only minor increases in transit’s miniscule market share and in some cases there have been declines.
In the case of Los Angeles, on which the Grand Jury relies for its conclusion favoring light rail development, three one-half cent sales taxes and spending that has amounted to more than $16 billion on development of new rail lines. Yet, transit ridership has fallen, as reported in the Los Angeles Times (see: “Just How Much has Los Angeles Transit Ridership Fallen”). Former SCRTD (predecessor to the MTA) Chief Financial Officer Thomas A. Rubin has also suggested that the MTA ridership decline may be greater if adjusted for the increased number of transfers that have occurred in the bus-rail system compared to the previous bus system (For example, a person traveling from home to work who starts on a bus, transfers to rail and finished the trip on a bus, counts as three, not one).
Required Responses:
The Grand Jury report notes:
“The California Penal Code Section 933 requires the governing body of any public agency which the Grand Jury has reviewed, and about which it has issued a final report, to comment to the Presiding Judge of the Superior Court on the findings and recommendations pertaining to matters under the control of the governing body. Such comment shall be made no later than 90 days after the Grand Jury publishes its report (filed with the Clerk of the Court).”
This would apparently require a response by August 9, 2016
Permission Granted to Cite or Quote this Article or the Linked Documents
Any respondent is hereby granted permission to cite or quote from this article or the linked documents.
There seems to be no end to the difficulties facing Honolulu’s urban rail project. In an editorial, Honolulu’s Civil Beat noted that federal officials fear the project cost may reach $8.1 billion, which is more than 50 percent above the “original estimate” of $5.2 billion. The cost blowout of nearly $3 billion would be far more than state consultants suggested in a 2010 report. That report, by the Infrastructure Management Group (IMG) in conjunction with the Land Use and Economic Management Group of CB Richard Ellis and Thomas A. Rubin estimated a “most likely scenario” in which the rail cost overrun would have been $909 million (Note).
This is, however, a particular concern to local citizens, since it has been suggested that no rail project has cost more in relation to its population base in US history. If the the project costs $8.1 billion, the IMG et al report estimate will have turned out to be far too conservative, less than one-third the overrun. At $2.9 billion this extra cost is nearly $3,000 for every man, woman and child in Honolulu. It is more than $8,500 per household.
The Civil Beat editorial is here.
Note: Thomas A. Rubin’s more recent analysis of rail and transit ridership in Los Angeles is here.
The Washington Metro passenger safety fiasco (see: America’s Subway: America’s Embarrassment?) has only gotten worse. On May 10 the Washington Post reported the federal government has twice threatened to close the system if the Washington Area Metropolitan Transportation Authority (WMATA) failed to “take actions to keep passengers safe.” U.S. Secretary Anthony Foxx.
According to the Post, “The most recent incident to illicit that threat came last Thursday after an arcing insulator exploded near a platform at Federal Center SW. The explosion, a fireball followed by a shower of sparks, was captured by Metro’s security cameras. On Tuesday, at a sit down with reporters, Transportation Secretary Anthony Foxx described his reaction to the video. ‘It was scary.’”
But Foxx went on to say that “even more worrisome was Metro’s conduct following the incident.” Foxx indicated that Metro’s response had not been sufficient in view of the seriousness of the incident.”
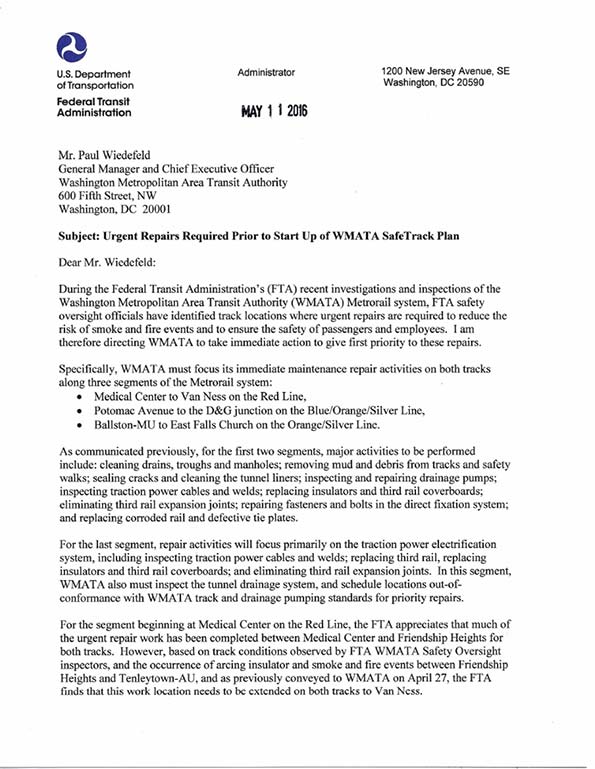
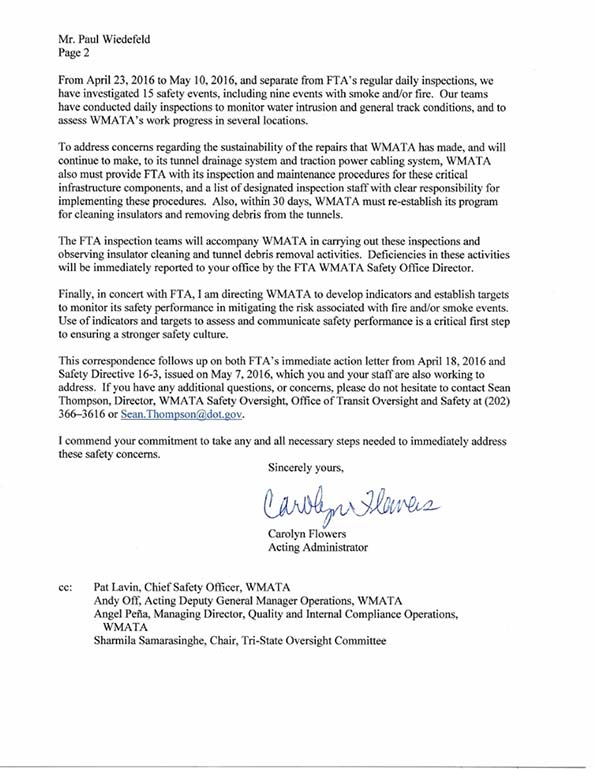
On the next day (May 11), Federal Transit Administration Acting Administrator Carolyn Flowers took the unusual action of a letter to WMATA General Manager Paul Wiedefeld, itemizing and prioritizing the necessary repairs: “I am therefore directing WMATA to take immediate action to give first priority to these repairs.” The letter is reproduced below.
On the same day, the Post editorialized (“Metro’s Dangerous Complicity”): “An overhaul in Metro’s culture is what is needed; that begins with accountability.
Not only is this an embarrassment for America’s Subway (as a previous Washington Post article suggested, see “Metro sank into crisis despite decades of warnings”), but the necessity for the nation’s second most patronized subway, in perhaps the nation’s most sophisticated metropolitan area, having to be directed (appropriately) by a federal agency is even more astounding.
At the same time, it is important to note the extraordinary nature of this case. There are many Metro (heavy rail) systems in the nation, as well as many light rail and commuter rail systems. Nor should it be assumed that Metro’s burden is anything more than a result of its own failures. Somehow, for example, New York’s subway manages to safety carry more than 10 times as many riders. None of the many systems has ever required such intervention by the federal government on passenger safety, which is perhaps the most basic requirement of transportation systems. This is not “business as usual.”


“California Commuters Continue to Choose Single Occupant Vehicles,” according to a report by the California Center for Jobs and the Economy. The Center indicated:
“The recent release of the 2014 American Community Survey data provides an opportunity to gauge how California commuters have responded to this shifting policy. The data clearly reflects that even with the well-documented and rapidly rising costs of the state’s traffic congestion and costs associated with the deteriorating condition of the state’s roads, California workers continue to rely on single occupant vehicles for the primary mode of commuting. Moreover, their reliance on this mode of travel continues to grow both in absolute and relative terms (emphasis in original).
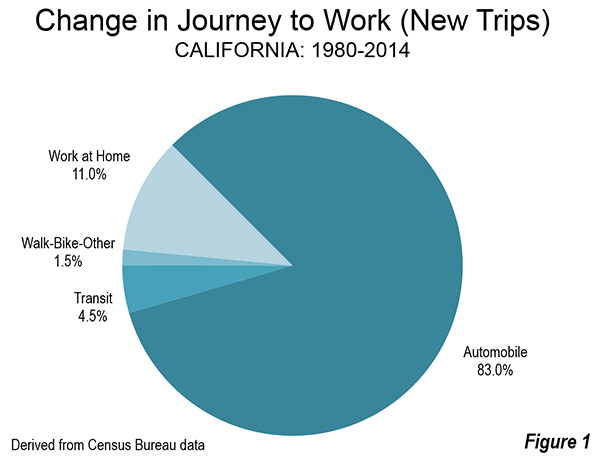
California has experienced substantial growth since 1980. There are approximately 7,000,000 more workers today than 35 years ago. The Census Bureau data shows that 83 percent of the new commuting has been by single-occupant automobile. Working at home accounted for 11 percent of the new commuting, while transit accounted for less than one half that figure, at 4.5 percent (Figure). In 1980, transit accounted for more than three times the volume as working at home. By 2014, the number of people working at home exceeded that of transit commuters.

The Center noted that state policies to discourage single-occupant commuting had been of little effect:
“The substantial investments in public transit, bike lanes, and other alternative modes have not produced major gains in commuter use. Instead, these investments appear to have simply shifted the choices made by commuters who already are committed to getting to work through modes other than single occupant vehicles. From 1980 to 2000, public transit use grew by 116,000 while “other” modes dropped by the same amount. From 1980 to 2005, public transit use grew by 121,000 while “other” modes dropped by 113,000. In the following years, 1/3 of the growth in public transit and “other” modes was offset by reductions in carpool use.”
The report credited impressive public transit gains in the San Francisco Bay Area, but went on to say that:
“even in the Bay Area, growth of public transit and the “other modes” has come largely from the shrinking relative use of carpooling.”
While improving transit ridership is a good thing, to the extent that it removes passengers from car pools, there is no gain in traffic, because the car and driver are still on the road.
The report laid considerable blame on the cost of houses in California:
“California, the growing body of land use, energy, CEQA, and other regulations affecting housing cost and supply has put both the cost of housing ownership and rents within traditional employment centers out of the reach of many households.”
California’s housing affordability is legendarily desperate. Since the imposition of strong land use regulations began in the early 1970s, the median house price has risen from three times (or less) times median household incomes in of the state’s metropolitan areas to over nine times today in the San Jose and San Francisco metropolitan areas, over eight times in the Los Angeles and San Diego areas and over five times in the Riverside-San Bernardino area (Inland Empire).
Perhaps the most important “take-away” from the report was that: “The current de facto policy of trying to reduce commuting by increasing congestion and its associated costs to commuters has to date not shown itself to be successful.” Simply stated, the vast majority of jobs and destinations in all of California’s urban areas are not accessible by transit in a reasonable time. The question for most California commuters is, for example, not whether to drive or take transit to work, but whether to go to work at all, since most jobs are not readily accessible except by car.
|


