.jpg")
For more than 40 years, US cities have rushed to build new rail systems (indeed I was part of such an effort, see Los Angeles: Rail for Others). This article examines the trend in transit and driving alone work trip market share in 23 cities (metropolitan areas) that have built new rail systems that have represented material expansions of regional transit systems. These new rail systems include Metros ("heavy rail"), light rail (not streetcars) and commuter rail (suburban rail). The capital costs of these systems have been at least $90 billion (2013$), based on Thoreau Institute website information.
A Policy Perspective
The perspective is that of a policy board member (which I was) and a belief that more transit (generally a good thing) is better than less. Thus, from the beginning of my career on the Los Angeles County Transportation Commission (LACTC), I was interested in obtaining the highest ridership possible within the constraints of available funding. As the LACTC considered building rail, a foremost objective was the hope for reduced traffic congestion, as we were assured by consultants that rail would attract drivers out of cars and reduce traffic congestion. To do this the rail system would need to reduce automobile travel.
Methodology
The work trip market shares of 2013 (from the American Community Survey) are compared to those of the US Census immediately preceding the opening of the rail system, except where otherwise noted. This latest data is compared to work trip market shares for the Censuses preceding rail system openings, using current (2013) metropolitan area boundaries. This method favors transit, since metropolitan areas have grown spatially, and the more recently added areas (counties) would have had lower transit market shares in earlier censuses. The method also favors transit because in a growing metropolitan area (which excludes only Buffalo among the 23 cities) merely retaining transit work trip market share will generally not reduce traffic congestion, because highway traffic volumes tend to rise with population.
Transit Work Trip Market Shares
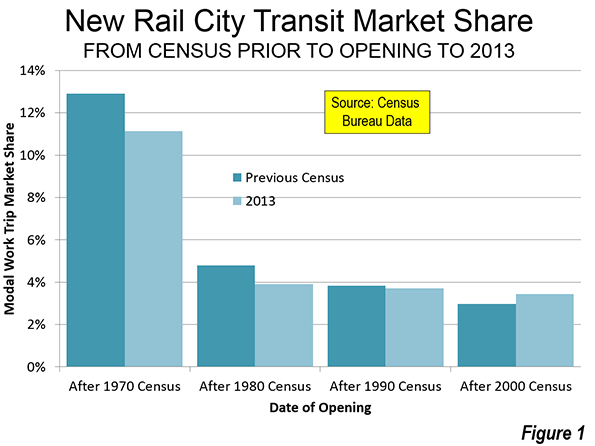
Overall, the average transit work trip market share in the 23 cities declined from 5.0 percent to 4.6 percent from the Census year preceding opening to 2013 (Figure 1).
- The cities with rail systems opening after the 2000 Census did by far the best. In 2000, these cities had an average transit work trip market share of 3.0 percent. By 2013, this had risen to an average of 3.4 percent. The cities in this category include Austin, Charlotte, Houston, Minneapolis-St. Paul, Nashville, Phoenix, and Seattle.
- The cities with rail systems opening after the 1990 Census experienced a modest decline in transit work trip market share, from 3.8 percent in 1990 to 3.7 percent in 2013. The cities in this category include Baltimore, Denver, Dallas-Fort Worth, Los Angeles, Riverside-San Bernardino, Salt Lake City, and St. Louis.
- The cities with rail systems opening after the 1980 census saw their transit work trip market shares decline more significantly, from 4.8 percent in 198to 3.9 percent in 2013. This category includes Buffalo, Miami, Portland, Sacramento, San Diego, and San Jose.
- The largest average transit work trip market share losses occurred in the cities with new rail systems that opened following the 1970 census. These metropolitan areas experienced a decline from 12.9 percent in 1970 to 11.1 percent in 2013. The new rail systems in this category were San Francisco's Bay Area Rapid Transit (BART), Washington's Metrorail and Atlanta's MARTA.
Driving Alone Work Trip Market Shares
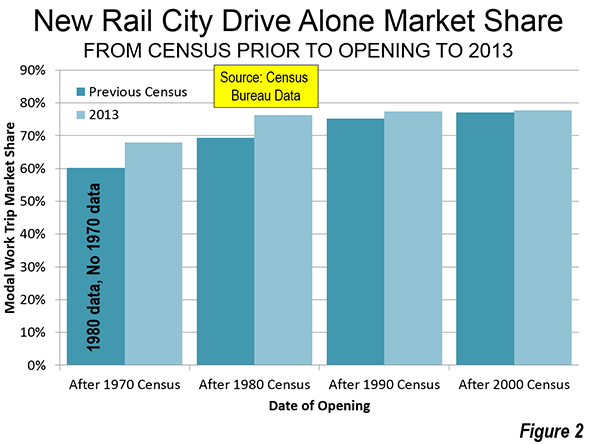
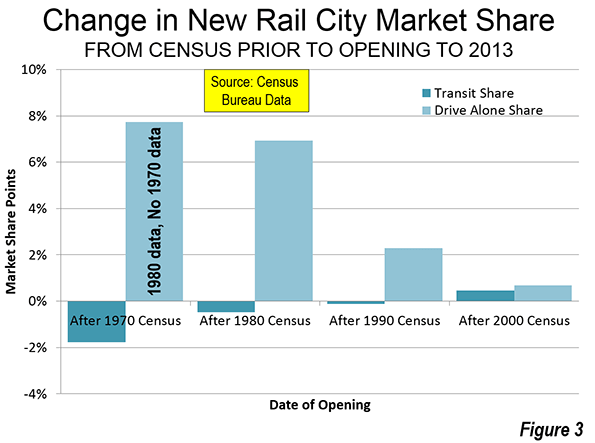
Overall, the driving alone work trip market share rose from 72.3 percent to 76.0 percent (though complete data is not available for 1970), an increase of 3.7 percentage points (Figure 2). The driving alone work trip market share declined in only 4 of the 23 cities. In each of the decadal categories, the change in work trip market share was greater in driving alone than in transit (Figure 3).
- The cities opening new rail systems after the 2000 census did the best in curbing the drive alone market share, but still experienced a loss. On average, the drive alone work trip market share increased the least in the cities, from 77.1 percent in 2000 to 77.7 percent in 2013, a rise of 0.6 percent.
- The cities opening new rail systems after the 1990 census experienced an increase in the drive alone work trip market share from 75.2 percent in 1990 to 77.4 percent in 2013m for a loss of 2.2 percentage points.
- The cities opening a new rail systems after the 1980 census experienced an increase in the drive alone work trip market share from 69.3 percent in 1980 76.3 percent in 2013, for a loss of 7.0 percentage points.
- Comparable driving alone data was not obtained in the 1970 Census, which makes it impossible to directly compare the "before and after" Census work trip market share data for new rail systems opening during. However, each of the three new rail systems opened after the 1970 census added substantially to their ridership following the 1980 census (Note). Even so, the drive alone market share from 1980 was substantial, from 60.2 percent to 67.9 percent in 2013, an increase of 7.7 percentage points. The biggest drive alone gains were in Atlanta, which built MARTA and Washington, which built Metrorail. San Francisco, with its Bay Area Rapid Transit system (BART) experienced a smaller drive alone market share gain from 1980 to 2013 (Table).
| Transit & Drive Alone Work Trip Market Share: Before and After | |||||
| 23 New Rail Cities | |||||
| City (Metropolitan Area) | Last Census before Rail Opening | Last Census Transit Share | 2013 Transit Work Trip Market Share | Last Census Drive Alone Share | 2013 Drive Alone Share |
| Atlanta: Note | 1970 | 7.3% | 3.1% | 68.3% | 77.7% |
| Austin | 2000 | 2.5% | 2.4% | 76.5% | 77.1% |
| Baltimore | 1990 | 7.7% | 6.8% | 70.9% | 77.1% |
| Buffalo | 1980 | 6.6% | 2.9% | 66.6% | 82.4% |
| Charlotte | 2000 | 1.2% | 1.7% | 80.9% | 80.2% |
| Denver | 1990 | 4.3% | 4.4% | 75.4% | 75.4% |
| Dallas-Fort Worth | 1990 | 2.3% | 1.4% | 78.6% | 80.5% |
| Houston | 2000 | 3.2% | 2.4% | 77.0% | 79.7% |
| Los Angeles | 1990 | 5.6% | 5.8% | 71.7% | 74.1% |
| Miami | 1980 | 4.4% | 4.1% | 72.6% | 77.8% |
| Minneapolis-St. Paul | 2000 | 4.2% | 4.6% | 78.3% | 78.4% |
| Nashville | 2000 | 0.8% | 1.0% | 80.6% | 82.8% |
| Phoenix | 2000 | 1.9% | 2.6% | 74.6% | 76.5% |
| Portland | 1980 | 7.9% | 6.4% | 65.3% | 70.7% |
| Riverside-San Bernardino | 1990 | 0.8% | 1.5% | 74.6% | 76.8% |
| Sacramento | 1980 | 3.4% | 2.6% | 75.3% | 75.1% |
| San Diego | 1980 | 3.3% | 3.2% | 63.8% | 75.8% |
| Seattle | 2000 | 7.0% | 9.3% | 71.6% | 69.7% |
| San Francisco: Note | 1970 | 15.9% | 16.1% | 57.9% | 59.9% |
| San Jose | 1980 | 3.1% | 4.2% | 72.4% | 75.9% |
| Salt Lake City | 1990 | 3.3% | 3.2% | 75.5% | 75.0% |
| St. Louis | 1990 | 2.9% | 2.9% | 79.4% | 83.2% |
| Washington: Note | 1970 | 15.5% | 14.2% | 54.2% | 66.1% |
| Average | 5.0% | 4.6% | 72.3% | 76.0% | |
| Derived from Census Bureau data | |||||
| Note: 1970 Census data not comparable for Drive Alone. 1980 data used | |||||
Transit Alone Metropolitan Area Gains and Losses
Overall, the transit work trip market share declined in 13 of the 23 cities. Among the 10 cities with an increase, the change was less than one percentage point in all but two, Seattle and San Jose.
The strongest transit market share gain was in Seattle, at 2.3 percentage points (from 7.0 percent to 9.3 percent). However, most of Seattle's transit market share gain was related to bus and ferry service, which accounted 80 percent of the transit gain. San Jose had the second largest gain, at 1.1 percentage points (from 3.1 percent to 4.2 percent). Riverside-San Bernardino (0.8 percent to 1.5 percent) and Phoenix (1.9 percent to 2.6 percent) tied for third best transit market share increase, with 0.7 percentage point increases. Charlotte had the fifth strongest increase, rising 0.5 percentage points, from 1.2 percent to 1.7 percent.
The largest transit market share loss was in Atlanta, which fell from 7.3 percent in 1970 to 3.1 percent in 2013, a loss of more than one-half. Buffalo suffered the second largest loss, from 6.6 percent to 2.9 percent, a decline of 3.7 percentage points. Highly touted Portland experienced the third greatest transit market share loss out of the 23 cities, falling from 7.9 percent to 6.4 percent, a 1.5 percentage point loss. Washington had the fourth largest decline, falling from a 15.5 percent transit work trip market share to 14.2 percent, a loss of 1.3 percentage points. In Washington, much of the Metrorail ridership was diverted from bus services and car pools.
Baltimore (from 7.7 percent to 7.0 percent) and Dallas-Fort Worth (from 2.3 percent to 1.4 percent) tied for 5th largest decline, with a loss of 0.9 percentage points.
Drive Alone Metropolitan Area Gains and Losses
The largest drive alone gains were in Buffalo (15.3 percentage point gain from 1980) San Diego (12.0 percentage point gain from 1980), Washington (11.9 percentage point gain from 1980, due to the lack of 1970 data), Atlanta (9.4 percentage point gain from 1980, due to the lack of 1970 data), and Baltimore (6.2 percentage point gain from 1990).
The largest drive alone market share losses were in Seattle (1.9 percentage point loss), Charlotte (0.7 percentage point loss), Salt Lake City (0.5 percentage point loss), and Sacramento (0.2 percentage point loss) while Denver remained constant.
New Rail Systems: Successful Simply in Being Built
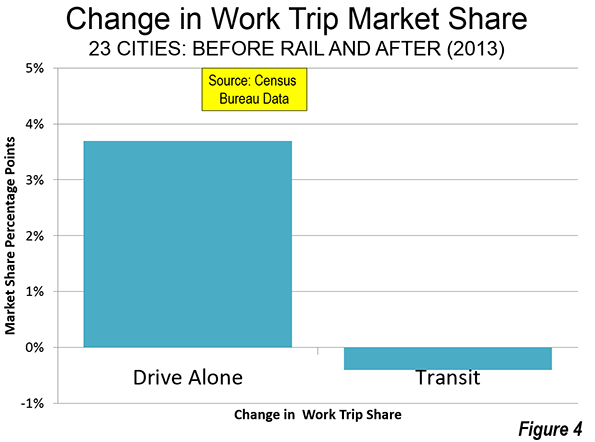
The overall transit work trip market shares in the 23 cities declined 0.4 percentage points. By comparison, in the same cities, driving alone increased by an average of 3.7 percentage points (Figure 4). These results are considerably more modest than the claims made by rail proponents. It is fair to say that the new rail systems have not changed how people travel in cities, despite costing at least $90 billion.
It might be expected that this laggard performance would dampen the ardor for rail. Yet, many public officials and civic boosters consider virtually any system that opens a success. Tom Rubin, former Chief Financial Officer of the Southern California Rapid Transit District (a predecessor to the Los Angeles County Metropolitan Transportation Authority) wryly suggests that for many political interests, the success of urban rail is demonstrated by its getting built.
Despite the unfortunate politics of transit, success requires carrying more passengers, as many as the available funding will permit. The test of urban rail is not how many people are on the trains, but how many drivers leave their cars at home to ride it.
Note: BART's ridership has more than tripled since 1980, while Washington Metrorail's ridership is up approximately 40 percent. MARTA's ridership has increased substantially since 1980, with the first line having opened only in mid 1979.
This commentary is adapted from a presentation in November at an international transit conference in Shanghai.
Wendell Cox is principal of Demographia, an international public policy and demographics firm. He is co-author of the "Demographia International Housing Affordability Survey" and author of "Demographia World Urban Areas" and "War on the Dream: How Anti-Sprawl Policy Threatens the Quality of Life." He was appointed to three terms on the Los Angeles County Transportation Commission, where he served with the leading city and county leadership as the only non-elected member. He was appointed to the Amtrak Reform Council to fill the unexpired term of Governor Christine Todd Whitman and has served as a visiting professor at the Conservatoire National des Arts et Metiers, a national university in Paris.
Photo: Atlanta MARTA train by RTABus (Own work) [CC-BY-SA-3.0], via Wikimedia Commons


Fixed rail transit can't work mathematically in large urban area
For over a century, we have known that people will not use fixed-rail transit, esp subways, if the subway station is more than 1/2 mile from the start or end point. This fact means that a subway system in Los Angeles is mathematically impossible.
Try to plan a subway system with 20 concentric circles where each one is 1 mile from the circles next to it.
In a huge circular geographic area like LA, it is mathematically impossible to construct a system which has stations within 1/2 mile of everyone. Manhattan can do it because it is 2.5 mi x 11 mi.
When one then takes into consideration the people who live in the suburbs and exurbs, their geographic distribution involves more math. If you have a string of towns where people have easy access to trains which they can ride into a compact urban center like Manhattan, the suburbs are fixed-rail friendly.
Places like Los Angeles, however, have a geography which makes them subway unfriendly. In fact, Los Angeles actually has no suburbs -- that is a concept which makes sense for older pre-auto cities which saw a flight into the countryside after WW II. It does not really make sense to say that Van Nuys is more a suburb than Hollywood or Westchester or West Hollwood. When we try to apply old terms to new situations, we make it hard to see reality.
BTW, subways should be free in LA. People who use them are already paying a high price. Time is money and the subways take huge amount of time and make life much harder on the riders. People who shun subways and drive,like I do, should share in the cost by paying more taxes to make subways FREE.
You are correct that LA
You are correct that LA cannot become a metro-connected region.
You are very wrong about the cost of subways. The people who are riding should pay the full, unsubsidized price. It is morally wrong to require someone living and working miles from a station to pay for the convenience of those who happen to be near one.
By your argument, airline travel should be free because they are usually faster than cars, and cars and gasoline should be free since they are faster than walking.
Measurement of Success
If the measurement of success is "how many drivers leave their cars at home", then the statistics need to reflect how many people would have driven if the rails had not been built.
In the city where I live, almost everyone on the train represents a car that is not on the road that day. If a higher percent choose to drive, that just means the price of gas is down.
Reducing congestion is not even the issue. The issue is that people can choose to reduce congestion, where they previously could not.
The new rail system will not ever pay for itself until the price of gasoline doubles. So people have 10 to 50 years to adjust their behavior. When the price of driving rises above the price of mass transit, people will look back and wonder why we invested so little on rail, and so much on roads.