For years, planners and others have raised concerns about the amount of land that urbanization occupies, especially in the United States and other developed nations. My attention was recently drawn to an estimate that 2.7% of the world's land (excluding Antarctica) is occupied by urban development. This estimate, which is perhaps the first of its kind in the world, is the product of the Columbia University Socioeconomic Data and Applications Center Gridded Population of the World and the Global Rural-Urban Mapping Project (GRUMP) and would amount to 3.5 million square kilometers.
While the scholars of Columbia are to be complimented for their ground breaking work, their estimate seems very high, especially in light of the fact that in the United States, with the world's lowest density urban areas, only 2.6% of land is urbanized. Further, the data developed for our Demographia World Urban Areas and Population Projections would seem to suggest a significant overstatement of urbanization's extent. Demographia World Urban Areas and Population Projections data are generally from national census authorities and examination of satellite photography.
The GRUMP overestimation is illustrated by the following.
GRUMP places the total of all urban extents in the United States at 754,000 square kilometers, more than three times the 240,000 square kilometers reported by the Bureau of the Census in 2000. This is despite the fact that GRUMP uses the same urbanization criteria as the Bureau of the Census. At the average GRUMP population density, most US urban areas would not even qualify as urban under the national standards used in countries such as the US, Canada, the UK and France.
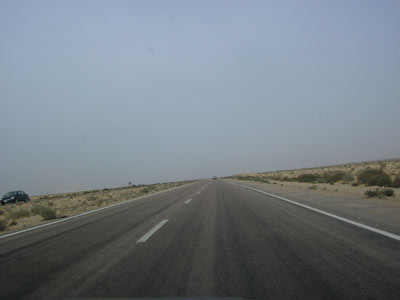
The overestimation can be illustrated by Cairo, which surrounded by desert land virtually devoid of urbanization. GRUMP places Cairo's urban land area ("urban extent") at 10,900 square kilometers. Cairo is well known among demographers as one of the world's most dense urban areas. Yet the GRUMP urban density, at 1,550 per square kilometer would make Cairo no more dense than Fresno, though somewhat more dense than Portland. The Demographia Cairo urban area is estimated at 1,700 square kilometers, more than 80% smaller. The contrast between the GRUMP and Demographia land area estimates is illustrated in the figure. There are a numerous additional discrepancies of similar scope.
One problem with the GRUMP estimates is their reliance on lights at night as observed from satellites. The problem is that lights illuminate large areas and any estimates based upon them would be likely to be inflated. Documentation associated with GRUMP acknowledges this effect, which it refers to as "blooming."
 But "blooming" is not the only problem. The poorest urban areas tend to have fewer lights and are thus illuminated to a larger degree than more affluent areas. The result, in the GRUMP data is that some of the project's most dense urban areas are in fact not the world's most dense. For example, low income Kinshasa (former Leopoldville), in the Democratic Republic of the Congo is indicated by GRUMP to be 40% more dense than Hong Kong. The reality is that Hong Kong is twice the density of Kinshasa, the difference being the effect of "blooming," combined with more sparse electricity consumption in the African urban area.
Demographia World Urban Areas and Population Projections accounts for more than 50% of world urbanization and includes all identified urban areas with 500,000 population or more. These urban areas cover only 0.3% of the world's land area. There is only the most limited data for smaller urban areas. However, it is generally known that smaller urban areas tend to be less dense than larger urban areas (which makes one wonder why the anti-sprawl interests have targeted larger urban areas). In the United States, the urban areas with less than 500,000 population average about one-half the density of larger urban areas. University of Avignon data indicates that the smaller urban areas of western Europe are about 60% less dense than the larger ones.
If it the US 50% less factor is assumed, then urbanization would cover approximately 0.85% of the world's land (1.1 million square kilometers).
If the European 60% less factor is assumed, then urbanization would cover 1% of the world's land (1.3 million square kilometers).
By these estimates, the GRUMP urbanization estimates would be more than 200% high.
GRUMP has contributed a useful term to the parlance of urban geography --- the "urban extent." An urban extent is simply continuous urbanization, without regard to labor markets or economic ties. For example,
The Tokyo urban extent might be considered to run from the southern Kobe suburbs, through the balance of the Osaka-Kobe-Kyoto urban area, Otsu, Nagoya, Hamamatsu, Shizuoka and through the Tokyo urban area to the northern suburbs, a distance of 425 miles (GRUMP calls the Tokyo urban extent the world's largest).
China's Pearl River Delta, with its physically connected but relatively economically disconnected, urban areas (including at least Hong Kong, Shenzhen, Dongguan, Guanzhou-Foshan, Zhongshan, Jiangmen, Zhuhai and Macao) is another example.
Despite its difficulties, the GRUMP project is an important advance and it is to be hoped will produce more accurate estimates in the future.
Note: The Demographia Cairo urban area is also the urban extent (the extent of continuous urban development). It includes the 6th of October new town and New Cairo, but excludes the 10th of Ramadan new town, which is physically disconnected from the Cairo urban extent.
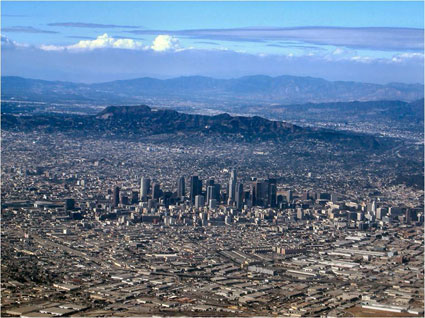
Photograph: In the GRUMP Cairo Urban Area (by the author)
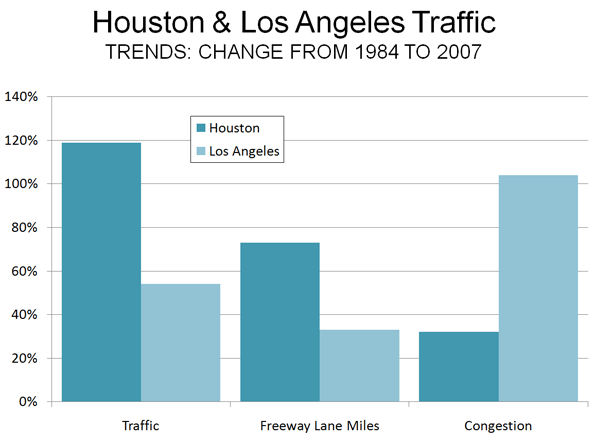
 There is a lesson from Los Angeles experience both for other areas and other government functions. The test of government performance is outputs, not inputs. Thus, it is appropriate to celebrate large transit market share increases or significant improvements in student achievement, not how many miles of rail are built or how much money is spent on education.