Los Angeles has grown more than any major metropolitan region in the high income world except for Tokyo since the beginning of the twentieth century, and also since 1950. In 1900, the city (municipality, see Note) of Los Angeles had little over 100,000 people and ranked 36th in population in the nation behind Allegheny, Pennsylvania (which has since merged with Pittsburgh) and St. Joseph Missouri (which has since lost more than one quarter of its population).
As people moved West in the intervening decades and especially after World War II, the Los Angeles area exploded in population. By 1960, the Los Angeles metropolitan area, which was then and is now composed of Los Angeles and Orange counties, had passed Chicago to become second in population only to the New York metropolitan area. It was to take considerably longer for the city of Los Angeles to pass the city of Chicago as the nation’s second largest municipality, though this occurred by the 1990 census.
The Los Angeles combined statistical area (analogous to the former consolidated metropolitan statistical area) is made up of three metropolitan areas, Los Angeles, Riverside – San Bernardino and Oxnard (Ventura County). This combined area covers 35,000 square miles or more than 90,000 square kilometers. This is a land area nearly as large as that of Hungary and larger than Austria. The overwhelming share of the CSA is rural, with less than 10 percent of the land area developed.
Growth from 1900: The CSA had only 250,000 people in 1900, though grew to nearly 5,000,000 in 1950. By 2010, the population was nearing 18 million, a figure not much less than that of Australia, at 22 million (Table 1). Indeed until 1990 the Los Angeles CSA population was closing in on Australia. However, since that time population growth in the Los Angeles area has slowed considerably and Australia should remain larger.
| Table 1 | ||||||||
| Los Angeles Combined Statistical Area: Population (CSA): 1900-2010 | ||||||||
| Year | City of Los Angeles | Balance: LA County | Los Angeles County | Orange County | Riverside County | San Bernardino County | Ventura County | Total |
| 1900 | 102,479 | 67,819 | 170,298 | 19,696 | 17,897 | 27,929 | 14,367 | 250,187 |
| 1910 | 319,198 | 184,933 | 504,131 | 34,436 | 34,696 | 56,706 | 18,347 | 648,316 |
| 1920 | 576,673 | 359,782 | 936,455 | 61,375 | 50,297 | 73,401 | 28,724 | 1,150,252 |
| 1930 | 1,238,048 | 970,444 | 2,208,492 | 118,674 | 81,024 | 133,900 | 54,976 | 2,597,066 |
| 1940 | 1,504,277 | 1,281,366 | 2,785,643 | 130,760 | 105,524 | 161,108 | 69,685 | 3,252,720 |
| 1950 | 1,970,358 | 2,181,329 | 4,151,687 | 216,224 | 170,046 | 281,642 | 114,647 | 4,934,246 |
| 1960 | 2,479,015 | 3,559,756 | 6,038,771 | 703,925 | 306,191 | 503,591 | 199,138 | 7,751,616 |
| 1970 | 2,816,061 | 4,216,014 | 7,032,075 | 1,420,386 | 459,074 | 684,072 | 376,430 | 9,972,037 |
| 1980 | 2,966,850 | 4,510,653 | 7,477,503 | 1,932,709 | 663,166 | 895,016 | 529,174 | 11,497,568 |
| 1990 | 3,485,398 | 5,377,766 | 8,863,164 | 2,410,556 | 1,170,413 | 1,418,380 | 669,016 | 14,531,529 |
| 2000 | 3,694,820 | 5,824,518 | 9,519,338 | 2,846,289 | 1,545,387 | 1,709,434 | 753,197 | 16,373,645 |
| 2010 | 3,792,621 | 6,025,984 | 9,818,605 | 3,010,232 | 2,189,641 | 2,035,210 | 823,318 | 17,877,006 |
| Consolidated statistical area as defined by OMB as of 2010 | ||||||||
The city of Los Angeles had grown 88 percent from 1950 to 2000, but over the past decade added only three percent to its population. Even more spectacular declines in growth occurred in the rest of the CSA. For example, Orange County had grown 1200 percent between 1950 and 2000 yet grew only six percent in the last decade.
Growth: 2000 to 2010: The population growth in the Los Angeles CSA was widely dispersed and away from the core. The central area (urban core) of the city Los Angeles extends from the Santa Monica Mountains to South Los Angeles and from the boundaries of Beverly Hills, West Hollywood and Culver City to East Los Angeles grew only 0.7 percent. Uniquely, the central area densified strongly between 1960 and 2000, while other urban cores nearly all declined in population, whether in the United States or Western Europe. Much of this was due to strong immigration from Mexico, other parts of Latin America, as well as Asia.
The inner suburban ring, which includes the balance of Los Angeles County south of the Santa Susana and San Gabriel Mountains as well as the older northwestern Orange County suburbs grew by 1.5 percent. Within this area, 32 inner suburbs (all in Los Angeles County) grew from 1.766 million to 1.767 million (0.1 percent) from 2000 to 2010 (Note 2).
The outer suburbs, which include the balance of Orange County (including the Mission Viejo urban area) and the western portions of Riverside and San Bernardino counties (including the Riverside – San Bernardino urban area) grew 19 percent.
The exurban areas, which include areas outside the core urban areas of Los Angeles, Riverside-San Bernardino and Mission Viejo grew 30 percent. The hot spots included Ventura County, the Santa Clarita Valley, the Antelope Valley, the Victorville-Hesperia area, the Coachella Valley (Indio-Palm Springs), the Hemet area and the Temecula-Murrieta area. An argument could be made that Temecula-Murrieta would be in the San Diego metropolitan area if metropolitan areas were defined by smaller area units, such as municipalities (as in Canada) or census tracts. The exurban areas are more attractive to residents at least in part because of considerably less expensive housing and their greater availability of detached houses than in the three core urban areas.
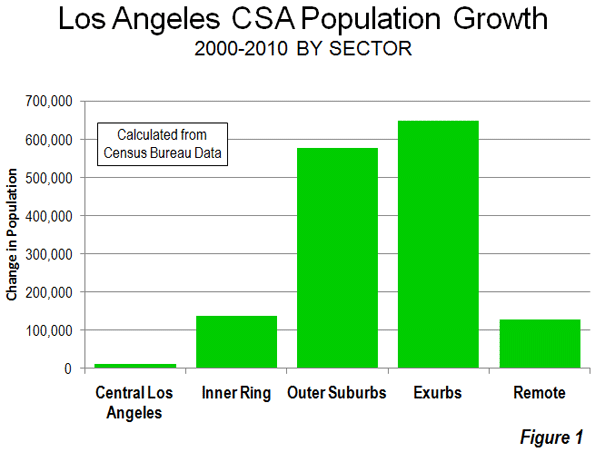
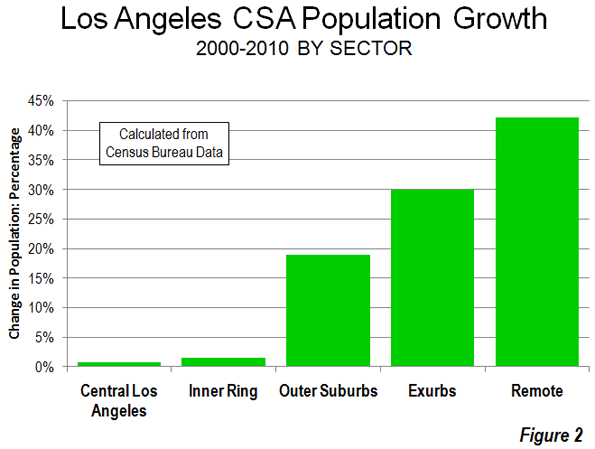
More remote areas of the desert extending to the Nevada and Arizona borders added 42 percent to their population (Table 2, Figure 1 and 2).
| Table 2 | ||||
| Los Angeles CSA: Population by Sector: 2000-2010 | ||||
| Sector | 2000 | 2010 | Change | % Change |
| Central Los Angeles | 1,752,024 | 1,763,967 | 11,943 | 0.7% |
| Inner Ring | 9,093,756 | 9,231,513 | 137,757 | 1.5% |
| Outer Suburbs | 3,053,615 | 3,630,273 | 576,658 | 18.9% |
| Exurbs | 2,173,459 | 2,822,884 | 649,425 | 29.9% |
| Remote | 301,331 | 428,369 | 127,038 | 42.2% |
| Total | 16,374,185 | 17,877,006 | 1,502,821 | 9.2% |
City of Los Angeles: The dispersion of population was also evident in the city of Los Angeles. For decades, the city of Los Angeles has grown strongly. Approximately one-quarter of this growth since 1960 has been the densifying central area, as noted above.
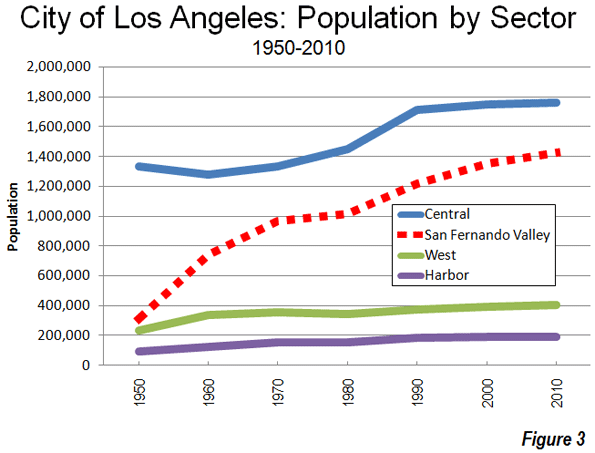
However, little noted is the fact that most of the city's growth was greenfield suburban in nature, built at low and moderate densities and largely car-oriented. For most of the past fifty years the growth has been “over the hill” in the San Fernando Valley, a formerly rural area which was annexed by the city before 1930. Between 1950 and 2010, the population of the San Fernando Valley grew from 300,000 to 1,400,000. Thus, the Valley grew like virtually every fast-growing historical core city in the nation that has grown since 1950, by filling up empty land (Figure 3).
Much has been written about the “Manhattanization” of the Los Angeles core. However, with only 13 towers more than 550 feet, downtown Los Angeles is no threat to Manhattan, with more than 125, or even Chicago with more than 70. Further, job growth is stagnant, with virtually no change in private sector employment over the last decade, despite substantial government subsidies.
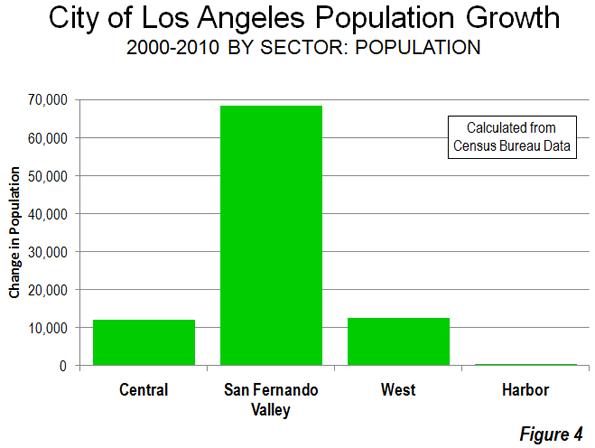
Between 2000 and 2010, the central area grew at its slowest rate since the 1950s, growing by only 0.7 percent to its population, growing only 12,000 (to 1,764,000) or barely 12 percent of the city's growth. Nonetheless, and contrary to the reputation of Los Angeles, the central area is very densely populated, at approximately 14,000 people per square mile, with the highest density census tracts having more than 90,000 residents per square mile. Among the nation's largest municipalities, only New York and San Francisco are denser than central Los Angeles.
The big story in growth was on periphery. The San Fernando Valley captured 70 percent of the city's growth in the 2000s, with considerable greenfield expansion in the hills north of Chatsworth and Northridge. Even so, the Valley's growth was only five percent. The western portion of the city, which extends from the Santa Monica Mountains to Los Angeles International Airport, grew three percent and accounted for 13 percent of the city's growth. The Harbor area added two percent to its population and accounted for five percent of the city's growth (Figure 4).
The Future: Growth or Stagnation? After more than a century of spectacular growth, Los Angeles demographic juggernaut is stagnating and could conceivably go in reverse due to declining immigration, an exodus of middle class and working class families. Indeed Even the strong growth in the outer suburbs and exurbs was not sufficient to drag the regional population increase (9 percent) up to the national rate of 10 percent between 2000 and 2010.
The immediate prognosis should be for even slower growth. The financial, regulatory and cost of living disadvantages of California are widely recognized by households and businesses alike. With stronger regulations in the offing, such as the stronger land use restrictions likely to occur as a result of Senate Bill 375, any future growth on the periphery could be dampened. Even with multi-billion support in terms of tax breaks and public investment, the central core seems unlikely to come close to making much of a real difference, at least beyond the media. Los Angeles may not be on the road to Rust Belt stagnation, but the dynamism of the last century is no more.
------
Note 1: In this article, the term "city" means municipality.
Note 2: This includes municipalities and census designated places nearest the central area of the city of Los Angeles, from Glendale and Pasadena through Monterey Park to South Gate, Compton and Gardena and to the west of the central area.
Note 3: Biographical Note: The author was born in the Echo Park district, near downtown Los Angeles.
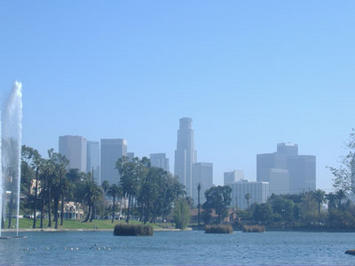
Photograph: Downtown Los Angeles from Echo Park (by author)
Wendell Cox is a Visiting Professor, Conservatoire National des Arts et Metiers, Paris and the author of “War on the Dream: How Anti-Sprawl Policy Threatens the Quality of Life”


demography
thank you for this great post. I found very useful info here.
musluman evlilik
reply demography
understand how excellent this. I came across helpfulvery usefulvery beneficial info the following. clash of clans hack
Determining every individual
Determining every individual sketchy SEO assistance is probably not probable, nonetheless have any advised assistance which should assist any individual receive a excellent and great quality amount for SEO alternatives. affair dating sites
The Bodyweight Flow review
The Bodyweight Flow review shows it includes three different calendars labeled beginner, intermediate, and advanced that help organize monthly workouts with the exercises. http://betcrownbasics.mono.net/
Create a personal connection
Create a personal connection with your reader. Your online ads should be published in first- or second-person to create the website guest think that the email or article is published specifically with their interests at heart. Pixels Trailer
This is really a nice and
This is really a nice and informative, containing all information and also has a great impact on the new technology. Thanks for sharing it,
girlfriend system
Hello, I have browsed most
Hello, I have browsed most of your posts. This post is probably where I got the most useful information for my research. Thanks for posting, maybe we can see more on this. Are you aware of any other websites on this subject.
https://www.rebelmouse.com/reviewsfatlossfactor/
It is the best time to make
It is the best
time to make a few plans for the long run and it is time to be happy. I have learn this put up and if I could I desire to suggest you few
interesting things...
clash of clans cheats
Wow i can say that this is
Wow i can say that this is another great article as expected of this blog.Bookmarked this site..
cormar carpets
Thank you for an additional
Thank you for an additional great post. Exactly where else could anybody get that kind of facts in this kind of a ideal way of writing? I have a presentation next week, and I’m around the appear for this kind of data.
http://www.theofficialwebsite.co/christian-h-girlfriend-activation-system-review/