NewGeography.com blogs
Even the New York Times has to admit unpleasant realities, like the departure of people from California and other deep blue states. But one thing the paper, and other similarly-minded reporters based here, will never admit: the connection between the California economy and regulation and the rising out-migrations.
The Times accepts that people are leaving in part due to costs, but puts much emphasis on other factors, like the decline in immigration under the monstrous Trump, Covid deaths and falling birthrates. Yet these factors have occurred across the country, and other regions, notably in the sunbelt and the South, have experienced rapid population growth. It turns out that policy choices that California has made seems the likely prime cause for the state’s shocking demographic decline.
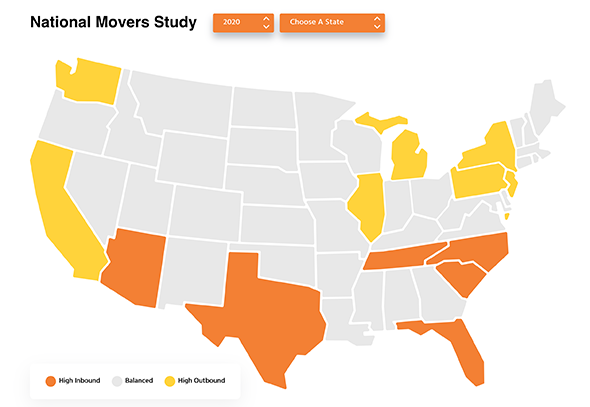
This net out-migration, as the Times admits, has been going on for decades. Some people, particularly in academia and the mainstream media, continue to label claims of an “exodus” as essentially false; the LA Times, a good barometer of political correctness on the West Coast, called it “a myth” reflective of the political bias of “haters.” But as we show in our recent Chapman University report, since 2000, California has lost 2.6 million net domestic migrants — more than the current combined population of San Diego, San Francisco, and Anaheim (the cities).
In 2020, California accounted for 28% of all net domestic out-migration in the nation — about 50% more than its share of the US population (19%).
Read the rest of this piece at UnHerd.
Joel Kotkin is the author of The Coming of Neo-Feudalism: A Warning to the Global Middle Class. He is the Roger Hobbs Presidential Fellow in Urban Futures at Chapman University and Executive Director for Urban Reform Institute. Learn more at joelkotkin.com and follow him on Twitter @joelkotkin.
A commenter on the article (Comparing Urban Densities: Winnipeg and New York) expressed an interest in seeing the extent of the New York urban area. The main page of the Census Bureau map is posted here (PDF, 9MB). The map is difficult to read, but easier if the zoom function is employed. The New York urban area is defined by a black line, and extends:
- South to the southern tip of Long Beach Island, in Ocean County, New Jersey, about 10 miles from the city limits of Atlantic City --- about 85 miles south of Manhattan (“as the crow flies”).
- West to within 7 miles of the Pennsylvania border, in Warren County, New Jersey --- about 50 miles west of Manhattan.
- North to southern Dutchess County, New York --- about 60 miles of Manhattan)
- East to 25 miles west of Montauk, New York (east end of Long Island) --- about 85 miles east of Manhattan.
The entire map is available here and contains 22 maps with more detailed information.
In 2010, the New York urban area covered 3,450 square miles (8,936 square kilometers), with a population of 18.351 million and a population density of 5,319 per square mile (2,054 per square kilometer). Among the large urban areas in the United States, New York was the fourth densest, trailing Los Angeles (6,999 per square mile), San Francisco (6,267 per square mile) and San Jose (5,820 per square mile).
Urban areas are defined by Census Bureau criteria principally using population density of continuously developed urbanization. The 2010 census urban area criteria are here. The 2020 data has not yet been released.
Metropolitan areas are organized around urban areas, and their corresponding “central counties.” The central counties associated with a particular urbanized area or urban cluster are grouped to form a single cluster of central counties for purposes of measuring commuting to and from potentially qualifying outlying counties. Central counties are defined as “those counties that:
- Have at least 50 percent of their population in urban areas of at least 10,000 population; or
- Have within their boundaries a population of at least 5,000 located in a single urban area of at least 10,000 population.”
Metropolitan areas comprise the central counties and “outlying counties that meet commuting interchange criteria. Urban areas can have small extensions into counties not within the corresponding metropolitan area, such as Warren County, New Jersey and Dutchess County, New York as in the case of the New York urban area (above).
Due to the huge size of the New York urban area, all but one of the 23 metropolitan counties is “central.” Only Pike County, Pennsylvania is an “outlying” county.
There is a misimpression that metropolitan areas are organized around commuting into central business districts, or central cities (municipalities). In fact, the current commuting criteria relates only to central counties --- the 22 in New York metropolitan area, not Manhattan or the city of New York.
Wendell Cox is principal of Demographia, an international public policy firm located in the St. Louis metropolitan area. He is a founding senior fellow at the Urban Reform Institute, Houston, a Senior Fellow with the Frontier Centre for Public Policy in Winnipeg and a member of the Advisory Board of the Center for Demographics and Policy at Chapman University in Orange, California. He has served as a visiting professor at the Conservatoire National des Arts et Metiers in Paris. His principal interests are economics, poverty alleviation, demographics, urban policy and transport. He is co-author of the annual Demographia International Housing Affordability Survey and author of Demographia World Urban Areas.
Mayor Tom Bradley appointed him to three terms on the Los Angeles County Transportation Commission (1977-1985) and Speaker of the House Newt Gingrich appointed him to the Amtrak Reform Council, to complete the unexpired term of New Jersey Governor Christine Todd Whitman (1999-2002). He is author of War on the Dream: How Anti-Sprawl Policy Threatens the Quality of Life and Toward More Prosperous Cities: A Framing Essay on Urban Areas, Transport, Planning and the Dimensions of Sustainability.
New population estimates by census authorities in Canada (Statistics Canada) and the United States (Bureau of the Census) show that cities (municipalities) with the largest central business districts lost residents in the year ended July 1, 2021. Currently data is available for seven of the 10 such municipalities, with US data only for cities that are also counties. Data is yet to be released for Chicago, Boston and Seattle. However, in each of these cases, the counties containing these cities lost population (Cook, Illinois; Suffolk, Massachusetts and King, Washington).
The largest loss was in the city of San Francisco, which lost 6.3% of its population, dropping from 870,000 to 815,000. This erases a decade of population growth (from 2011), when the city had 816,000 residents, according to the Census Bureau.
New York lost 3.5% of its population, dropping by 305,000. Washington fell 2.9%, while Philadelphia lost 1.5%.
The losses in Canada were less, but were nonetheless surprising, because Canadian core municipalities did not suffer the huge mid to late 20th century losses that afflicted US cities like Philadelphia, Boston and Washington. Montreal lost 2.5% of its population (45,000). Vancouver lost 1.0% of its population, which is considerable given the seemingly unending densification that has occurred there (unrivaled by any core municipality in the West that was virtually fully developed by mid-century and has had no significant annexations). Toronto lost 0.6%.

Wendell Cox is principal of Demographia, an international public policy firm located in the St. Louis metropolitan area. He is a founding senior fellow at the Urban Reform Institute, Houston, a Senior Fellow with the Frontier Centre for Public Policy in Winnipeg and a member of the Advisory Board of the Center for Demographics and Policy at Chapman University in Orange, California. He has served as a visiting professor at the Conservatoire National des Arts et Metiers in Paris. His principal interests are economics, poverty alleviation, demographics, urban policy and transport. He is co-author of the annual Demographia International Housing Affordability Survey and author of Demographia World Urban Areas.
Mayor Tom Bradley appointed him to three terms on the Los Angeles County Transportation Commission (1977-1985) and Speaker of the House Newt Gingrich appointed him to the Amtrak Reform Council, to complete the unexpired term of New Jersey Governor Christine Todd Whitman (1999-2002). He is author of War on the Dream: How Anti-Sprawl Policy Threatens the Quality of Life and Toward More Prosperous Cities: A Framing Essay on Urban Areas, Transport, Planning and the Dimensions of Sustainability.
For some years, the University of Minnesota’s Accessibility Observatory has produced major metropolitan area job access estimates for the average worker, at various trip lengths and modes. Estimates are provided for all the nation’s 53 major metropolitan areas (over 1,000,000 million), with the exception of Grand Rapids, Rochester and Tucson.
The data indicate auto access to jobs is far greater by car than by transit. This is shown below at the 30-minute job access level, which is slightly more than the average one-way work trip travel time of 28 minutes (about 60% of US workers reached work in 30 minutes), according to the American Community Survey (not counting people who work at home, who have no work trip travel time). At the median, cars can access, on average, 57.7 times as many jobs (5,770% as many jobs) as transit within 30 minutes.
The following table shows auto 30-minute access to jobs in relation to 30-minute access by transit, in terms of auto commuters per transit commuter. The table also indicates actual commuting patterns, express in the actual number of 30-minute auto commuters per 30-minute transit commuter, again from the 2019 American Community Survey. There is a strong correlation between the modeled 30-minute job access and the actual 30 minute commute data (0.686, statistically significant at the 99% level of confidence).
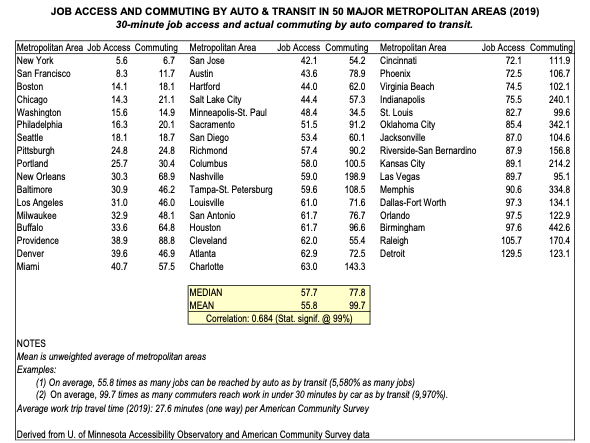
View or download a PDF of the table (link opens in new tab)
Finally, transit ridership has plummeted during the pandemic and has recovered far more slowly than other modes of transport, including driving and air (which are now between 80% and 100% of their pre-pandemic levels as well as Amtrak and transit, which are between 50% and 60% of their previous levels, according to Randal O’Toole. With the future of transit ridership uncertain, especially due to the massive increase in hybrid and remote working and a residual fear of proximity (infection), the car advantage could widen.
Wendell Cox is principal of Demographia, an international public policy firm located in the St. Louis metropolitan area. He is a founding senior fellow at the Urban Reform Institute, Houston, a Senior Fellow with the Frontier Centre for Public Policy in Winnipeg and a member of the Advisory Board of the Center for Demographics and Policy at Chapman University in Orange, California. He has served as a visiting professor at the Conservatoire National des Arts et Metiers in Paris. His principal interests are economics, poverty alleviation, demographics, urban policy and transport. He is co-author of the annual Demographia International Housing Affordability Survey and author of Demographia World Urban Areas.
Mayor Tom Bradley appointed him to three terms on the Los Angeles County Transportation Commission (1977-1985) and Speaker of the House Newt Gingrich appointed him to the Amtrak Reform Council, to complete the unexpired term of New Jersey Governor Christine Todd Whitman (1999-2002). He is author of War on the Dream: How Anti-Sprawl Policy Threatens the Quality of Life and Toward More Prosperous Cities: A Framing Essay on Urban Areas, Transport, Planning and the Dimensions of Sustainability.
|