
Much has been made – particularly in the Northeastern press – of the slowing down of migration to the South and West as a result of the recession. But in many ways this has obfuscated the longer term realities that will continue to drive American demographics for the coming decade.
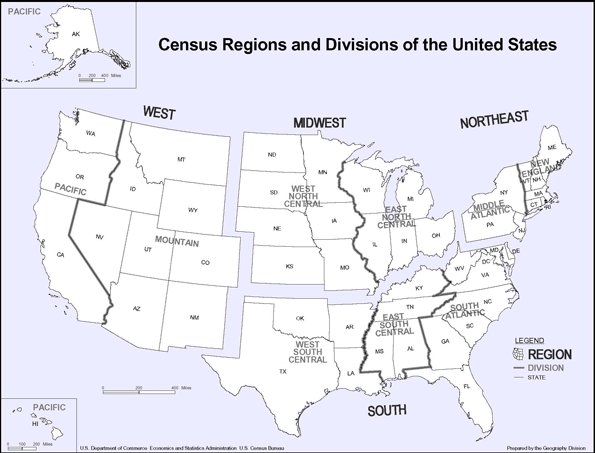
Americans have been moving from the Northeast and Midwest to the West and South for decades (see US region map). In the first four decades after the Second World War, the warm, dry climates of coastal California were a significant factor. As the nation became more mobile – aided by such things as inexpensive air travel and the interstate highway system and the spread of air conditioning – the larger migration pattern went towards the South. There were, of course, other factors. Business costs, particularly the costs of labor, were often lower in the West and especially the South. Personal taxes in some states were lower than in the Northeast and Midwest. Surely the period from the end of World War II to 2000 could be called the demographic “half-century” of the West and South.
The New State Census Estimates: The latest (July 1, 2009) Bureau of the Census release of state population estimates indicates a fundamental shift in migration patterns. Yes, even at recession-depressed rates, the Northeast and Midwest continue to export domestic migrants, but they are almost exclusively going to the South now, and not the West (See Table).
| Net Domestic Migration by State | ||||
| 2009 Rank | Net Domestic Migration | Rank 2000-2009 | ||
| State | 2009 | 2000-2009 | ||
| 1 | Texas | 143,423 | 838,126 | 2 |
| 2 | North Carolina | 59,108 | 663,892 | 4 |
| 3 | Washington | 38,201 | 239,037 | 9 |
| 4 | Colorado | 35,591 | 202,735 | 10 |
| 5 | South Carolina | 31,480 | 306,045 | 7 |
| 6 | Georgia | 26,604 | 550,369 | 5 |
| 7 | Tennessee | 20,605 | 259,711 | 8 |
| 8 | Oklahoma | 18,345 | 42,284 | 19 |
| 9 | Virginia | 18,238 | 164,930 | 12 |
| 10 | Oregon | 16,173 | 177,375 | 11 |
| 11 | Arizona | 15,111 | 696,793 | 3 |
| 12 | Louisiana | 14,647 | (311,368) | 45 |
| 13 | Alabama | 11,044 | 87,199 | 14 |
| 14 | Utah | 8,623 | 53,390 | 17 |
| 15 | Wyoming | 7,192 | 22,883 | 25 |
| 16 | Kentucky | 6,268 | 81,711 | 15 |
| 17 | Arkansas | 5,298 | 75,163 | 16 |
| 18 | West Virginia | 4,510 | 17,727 | 26 |
| 19 | District of Columbia | 4,454 | (39,814) | 37 |
| 20 | Massachusetts | 3,614 | (274,722) | 44 |
| 21 | New Mexico | 3,366 | 26,383 | 24 |
| 22 | Delaware | 2,580 | 45,424 | 18 |
| 23 | Montana | 2,410 | 39,853 | 21 |
| 24 | South Dakota | 1,619 | 7,182 | 27 |
| 25 | Idaho | 1,555 | 110,279 | 13 |
| 26 | North Dakota | 1,375 | (18,071) | 31 |
| 27 | Pennsylvania | 1,346 | (33,119) | 34 |
| 28 | Alaska | 979 | (7,360) | 29 |
| 29 | Missouri | (124) | 41,278 | 20 |
| 30 | Nebraska | (956) | (39,275) | 36 |
| 31 | Vermont | (975) | (1,505) | 28 |
| 32 | Kansas | (1,242) | (67,762) | 41 |
| 33 | Iowa | (2,135) | (49,589) | 40 |
| 34 | New Hampshire | (2,602) | 32,588 | 22 |
| 35 | Maine | (2,937) | 29,260 | 23 |
| 36 | Nevada | (3,801) | 361,512 | 6 |
| 37 | Hawaii | (5,298) | (29,022) | 33 |
| 38 | Mississippi | (5,529) | (36,061) | 35 |
| 39 | Wisconsin | (5,672) | (11,981) | 30 |
| 40 | Rhode Island | (6,172) | (45,159) | 38 |
| 41 | Indiana | (6,805) | (21,467) | 32 |
| 42 | Connecticut | (7,824) | (94,376) | 42 |
| 43 | Minnesota | (8,813) | (46,635) | 39 |
| 44 | Maryland | (11,163) | (95,775) | 43 |
| 45 | Florida | (31,179) | 1,154,213 | 1 |
| 46 | New Jersey | (31,690) | (451,407) | 47 |
| 47 | Ohio | (36,278) | (361,038) | 46 |
| 48 | Illinois | (48,249) | (614,616) | 49 |
| 49 | Michigan | (87,339) | (537,471) | 48 |
| 50 | New York | (98,178) | (1,649,644) | 51 |
| 51 | California | (98,798) | (1,490,105) | 50 |
| Derived from US Bureau of the Census data. | ||||
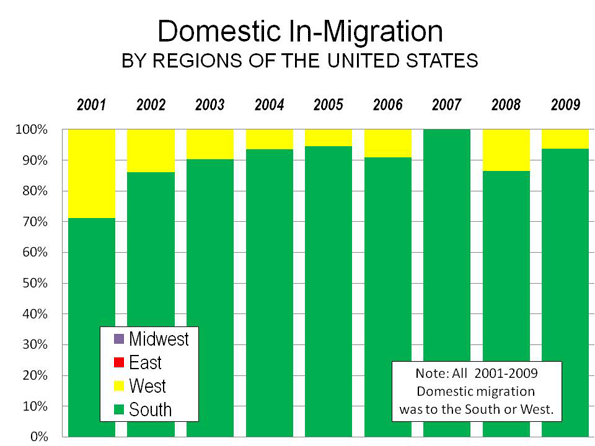
Moving to the South: Between 2000 and 2009, the South attracted 90% of domestic migrants from other states, with the West accounting for only 10% (see chart below). In 2001, the South attracted 71% of domestic migration but its share rose to 86% in 2002 and accounted for virtually all net migration by 2007. In that year, not only did the Northeast and Midwest lose domestic migrants, but also the West. By 2009, the South’s share of inbound domestic migration fell back to 94%.
Throughout the decade, the small share of domestic migration that did not go to the South went to the West, while the Northeast and Midwest continued to lose residents. The 2000s are best characterized as the demographic “decade of the South” because the vast majority of Americans moving between states moved South.
Nearly all states in the South gained domestic migrants during the decade. Only Mississippi, Maryland and Louisiana, along with the District of Columbia, lost domestic migrants. Even before Hurricanes Katrina and Rita, Louisiana was losing domestic migrants. Perhaps the big surprise is Florida, which has led the nation in domestic in-migration for years and has attracted 1.1 million from other states during the 2000s.
Florida’s peak came in 2004 and 2005, when more than a net 260,000 domestic migrants moved to Florida from other states. Things have changed markedly, however, with Florida rapidly losing domestic migrants in 2008 and 2009, very likely due to the impact of the housing bubble and an overreliance on inbound retirees to drive its economy.
However, Florida’s recent decline does not weaken the near-monopoly position of the South as the dominant destination of movers. Florida’s rapidly declining domestic migration has been largely replaced by a new domestic migration champion: Texas. In the early 2000s, Texas generally attracted from 30,000 to 50,000 net domestic migrants. Migration from Louisiana from Rita and Katrina propelled Texas to the top in 2006 and the state appears to have consolidated its position as the leader in domestic migration. In 2009, with domestic migration at more modest levels nationally, the Texas gain was more than any year except for 2006 with Hurricanes Katrina and Rita. But it’s not just a Lone Star story. Seven of the top ten states in domestic migration remained in the South in 2009. Throughout the entire decade, 6 of the top 10 states were from the South and 4 from the West. However, most of the gains in the West were simply from moving around (and from California); there was relatively little inter-regional domestic migration.
Moving Around the West (and Away from California): Most states in the West have also gained domestic migrants in the 2000s, with the exceptions of Alaska, Hawaii and California. California is the real story in the West, having lost nearly 1.5 million domestic migrants, a population greater than that of the city of San Diego. In 2000, California lost nearly 100,000 domestic migrants and for the fourth year in a row led the nation in net domestic out-migration. This includes 2006, when not even Louisiana’s catastrophic hurricanes could drive as many people away as California. During the first year of the decade, California lost only 45,000 net domestic migrants. By 2007, as the center of the worldwide housing bubble, California’s losses were 7 times that amount. In 2009, even with depressed migration rates associated with the recession, out migration more than doubled between 2001 and 2009.
California is simply not the draw that it used to be. There was a time, in the late 1930s, that the state tried to bar “Okies” from moving to the state, legislation wisely declared unconstitutional by the Supreme Court. Things have certainly changed. The latest Internal Revenue Service data indicates that every year during the 2000s, Oklahoma gained net domestic migrants from California.
Outside California, there has been healthy domestic in-migration in the West. However, California’s losses cancelled out more than 80% of the West’s gains during the decade. Much of the movement within the region was internal, with Californians shifting to markets where housing was less expensive (but still expensive), such as Arizona, Nevada, Washington and Oregon. More recently the movement to the housing bubble ground zero states of Arizona and Nevada, have all but disappeared, with far smaller gains in Arizona and a small net loss in Nevada in 2009.
In one year (2007), California lost more domestic migrants than all of the other states of the West gained. Domestic migration in the West remains largely about households moving around within the region: from California to other states, with a far smaller number arriving from elsewhere in the nation.
Escape from New York (and the Northeast): Domestic migrants continue to leave the Northeast, just as they have for decades. In the Northeast, only New Hampshire and Maine gained domestic migrants in the 2000s. However, it was a bit different in 2009. Both New Hampshire and Maine lost, while Massachusetts and Pennsylvania gained.
Pennsylvania has been the subject of more than one “what’s wrong with Pennsylvania” report as analysts inside and out decry its competitive position. In fact, by the ultimate measure of competitiveness, where people choose to move to or from, Pennsylvania has done relatively well in the 2000s. Pennsylvania’s modest loss of 33,000 domestic migrants pales by comparison to the net 2.5 million people who have moved away from neighboring New York, New Jersey, Maryland and Ohio. Like Texas, Georgia and many other states, Pennsylvania largely missed the housing bubble, which probably accounts for some of this surprising phenomenon.
But the relative success of Pennsylvania should not be touted, as the mainstream media would tend to, as a sign of general Northeastern resurgence. New York alone lost 1.65 million over the 2000-2009 period. This is, in absolute numbers, more than California and a larger percentage loss than Louisiana with Katrina and Rita. Critically, data through 2008 shows that most of the domestic migration losses came from New York City and to a lesser extent its suburbs. Upstate New York, which also missed the housing bubble, experienced comparatively modest domestic migration losses, as Ed McMahon and I showed in an Empire Center policy report earlier this year.
Hollowing out the Heartland: Domestic migrants are also deserting the Midwest, though in somewhat smaller numbers than in the Northeast. Only Missouri and South Dakota gained domestic migrants in the 2000s, although in 2009, Missouri experienced a small loss and was replaced by North Dakota as a gainer. But it is not a region-wide phenomena. Nearly 90% of the loss in the Midwest was in Illinois and the economic basket case states of Michigan and Ohio.
Slowing Migration: One of the principal stories out of this year’s Census release is that interstate domestic migration declined markedly in 2009. Indeed, domestic migration was lower than in any other year in the decade, but not by that much. In 2009, 500,000 people migrated between the states, compared to between 570,000 and 620,000 annually from 2001 to 2003. Then, from 2003 to 2007, interstate domestic migration was up to 1.25 million and averaged more than 900,000. The anomaly is not so much that domestic migration is down, but rather that domestic migration got so high in the middle part of the decade, at the very same time that house price differences reached unprecedented heights. It’s no wonder people were moving.
The Future? What comes next after the chaotic decade of the 2000s? As is suggested above, much of the variation in domestic migration is explained by differences housing prices and trends. Indeed, the price of housing may be a surrogate for the cost of living, which varies principally between areas based upon housing cost differences. This is likely to continue. In coastal California, house prices remained above historic norms, even at the largest “bubble burst” losses,” and there are recent indications that unhealthy price escalation has resumed. Much of the West and most of the country is far more affordable. This would suggest that coastal California’s domestic migration losses will continue and rise in the future.
By contrast, in much of the rest of California and the other “ground zero” states of Florida, Arizona and Nevada house prices have returned to historic norms, which suggests that after the recession, strong domestic in-migration could resume.
The future looks very bright for Texas and other states in the South that have done so well (such as North Carolina, South Carolina, Georgia, Tennessee, Oklahoma and even Arkansas). Their biggest challenge will be to resist the siren songs to become more like California, with its disastrous policies appreciated only by proponents and a fawning media.
Wendell Cox is a Visiting Professor, Conservatoire National des Arts et Metiers, Paris. He was born in Los Angeles and was appointed to three terms on the Los Angeles County Transportation Commission by Mayor Tom Bradley. He is the author of “War on the Dream: How Anti-Sprawl Policy Threatens the Quality of Life.”


Packers and Movers India
Thanks for sharing your info. I really appreciate your efforts and I will be waiting for your further write
Packers and Movers Noida
Packers and Movers Thane
Packers and Movers Navi Mumbai
Packers and Movers Ghaziabad
Packers and Movers Faridabad
Packers and Movers India
This article is really fantastic and thanks for sharing the valuable post.
Packers and Movers Delhi
Packers and Movers Bangalore
Packers and Movers Gurgaon
Packers and Movers Pune
Packers and Movers India
Thanks for post this helpful post - Please visit for More information about -
Packers and Movers Pune
Packers and Movers Hyderabad
Packers and Movers Mumbai
Packers and Movers Chennai
I like this post,And I guess
I like this post,And I guess that they having fun to read this post,they shall take a good site to make a information,thanks for sharing it to me.
http://abc6.com/story/28535943/the-girlfriend-activation-system-evaluates-benefits-of-gfas-v2-for-men
Hi! Thanks for the great
Hi! Thanks for the great information you havr provided! You have touched on crucuial points!
http://www.rebelmouse.com/secretsoftheirresistiblelover/
Great Article it its really
Great Article it its really informative and innovative keep us posted with new updates. its was really valuable. thanks a lot.
textyourexback2
Thanks for sharing the info,
Thanks for sharing the info, keep up the good work going.... I really enjoyed exploring your site. good resource...
http://girlfriendactivationsystem.co/
You know your projects stand
You know your projects stand out of the herd. There is something special about them. It seems to me all of them are really brilliant!
Check Us Out
Great post I would like to
Great post I would like to thank you for the efforts you have made in writing this interesting and knowledgeable article.
most recent posts
The website is looking bit
The website is looking bit flashy and it catches the visitors eyes. Design is pretty simple and a good user friendly interface.
http://www.ge.tt/30KeNpr1/v/0