
Population change in the state of Washington has relevance to the nation and to other states because it tells us something about market preferences of households versus the orientation of planners (e.g., “smart growth”). It tells us much about gentrification and America’s changing racial and ethnic diversity.
The summary will be in two parts. This piece will look at population growth and redistribution. A second article will review the growth of the minority population and its (surprising to some) redistribution and its relation to the gentrification of the city of Seattle, plus a look at the implications of ethnic change to Washington’s new 10th congressional district.
Washington state and the greater Seattle region grew fairly vigorously 14% (838,000 new residents) in the decade, as they have most decades for over a century. This growth is unusually high for a “non Sunbelt” state. This growth is due not just the engine of Seattle, as eastern and western Washington also experienced substantial growth.
Most smaller metropolitan areas across the state grew faster than the Seattle metropolitan core. Fast-growing counties are found in the east (Franklin 50%, the easy winner, Benton 23; Kittitas, 22; and Grant 20); all associated with Latino in-migration, as well as in the west (Clark, 23 %; suburban Portland, Mason, 23 percent; suburban Olympia, Thurston (Olympia) 22; Whatcom (Bellingham), 20; and Snohomish, finally, suburban Seattle, 18.
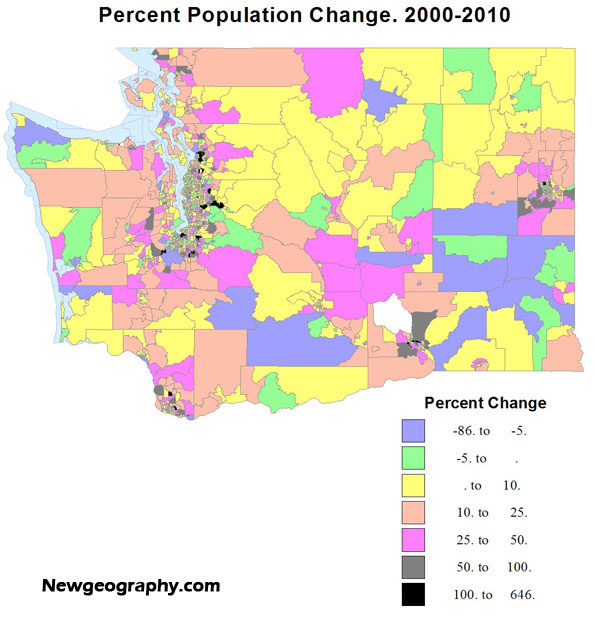
There are two Washingtons: greater Seattle and the rest of the state, marked by a love and hate relationship. But the balance of power – and demography – is clearly changing in both. There were a few areas of slow growth or decline, as in the heart of the wheat country, but significant growth took place in other metropolitan areas, most notably the Tri-Cities, Vancouver (suburban Portland), Bellingham, Olympia (the state capitol) as well as Spokane, Yakima, and Wenatchee.
There has been considerable population growth associated with the Columbia Basin project, fueled by heavy Latino in-migration and high birth rates. At the same time there has been population expansion in selected environmental amenity areas – often with retiree in-migration – in many counties across the state. Amenity fueled growth was dramatic in all directions beyond the metropolitan central Puget Sound core, but was also impressive in several areas in eastern Washington, as in Okanogan, Pend Oreille, and Stevens, the far north and northeast, and in Kittitas. Some of this growth comes from migration east from Seattle. Fourth, despite a growth management plan, metropolitan exurbs continue to expand, especially around Vancouver, Spokane, Bellingham and the Tri-Cities (black on the map, over 100% growth).
Turning to central Puget Sound, the most dramatic growth (often over 100 percent), occurred at the far edge of the urban growth areas, and just beyond as exurban growth. This is true in absolute numbers as well as rates. Growth management and upzoning have been unable to stem this tide, for two main reasons rarely acknowledged by planners: the preference of families with children for single family houses and greater housing affordability, at least in some areas (for example, King county south and east of Seattle, and south into Pierce county). Growth was also impressive in most rural and exurban areas, especially in Pierce, Snohomish and Kitsap counties, but far less in King county, which has by far the strictest growth controls
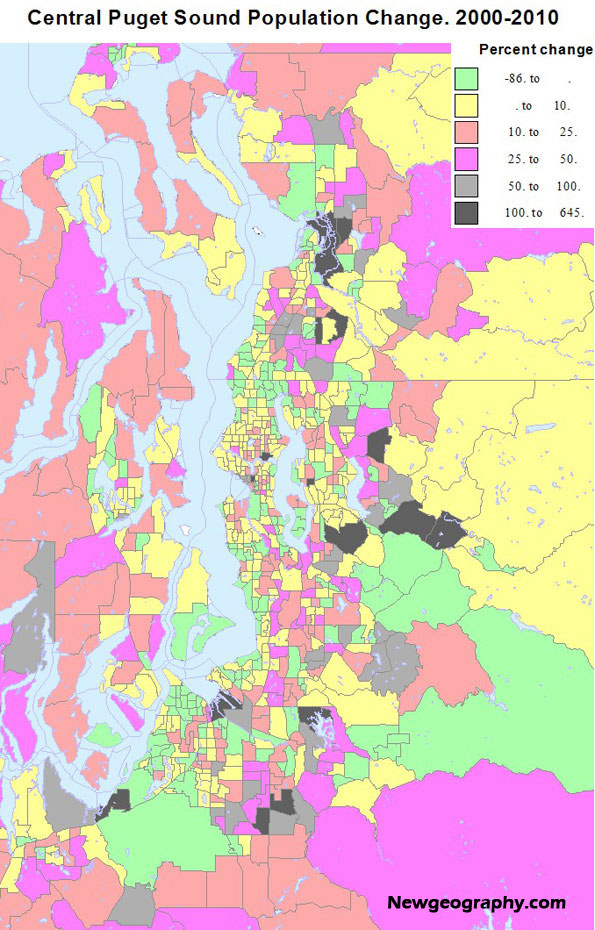
At the same time, there was concentrated growth in already urban areas, city and suburban, as higher density apartment sprang up across much of Seattle, Tacoma, south King county, in some Eastside cities, and in the SR 99 corridor of Snohomish county north from Seattle.
In Pierce, Snohomish and south King, some single family and small apartment growth occurred in less affluent areas, attracting many people, including young families who cannot afford to live closer to Seattle. Areas of slower growth tended to be military areas, some urban non-residential tracts, and some more affluent, older settled single family home areas, with an aging population. Growth in downtown Seattle and Bellevue, even Tacoma, was substantial, if not quite as great as planners envisioned. The current shift from home ownership to renting is leading some to project a projected apartment boom in or near downtown Seattle.
It’s also interesting to look at density as a measure of “urban-ness”. The third map for density is at a finer block group level. Moderate urban densities from 1000 to 5000 per square mile are dominated by single family homes, areas between 5000 and 7000, by a mix of single family homes and apartments, and over 7000 by apartments, essentially the density goal of urbanist smart growth planning. Seattle really has achieved a substantial degree of such urbanness, dominating central Seattle, but spreading to all corners of the city. Other areas of higher density include the SR99 corridor in Snohomish county, especially south Everett, high tech suburbs to the east, and in south King county the SR 99 corridor again, in some less affluent suburbs, and in Pierce county, downtown Tacoma, and some of South Tacoma toward Ft. Lewis.
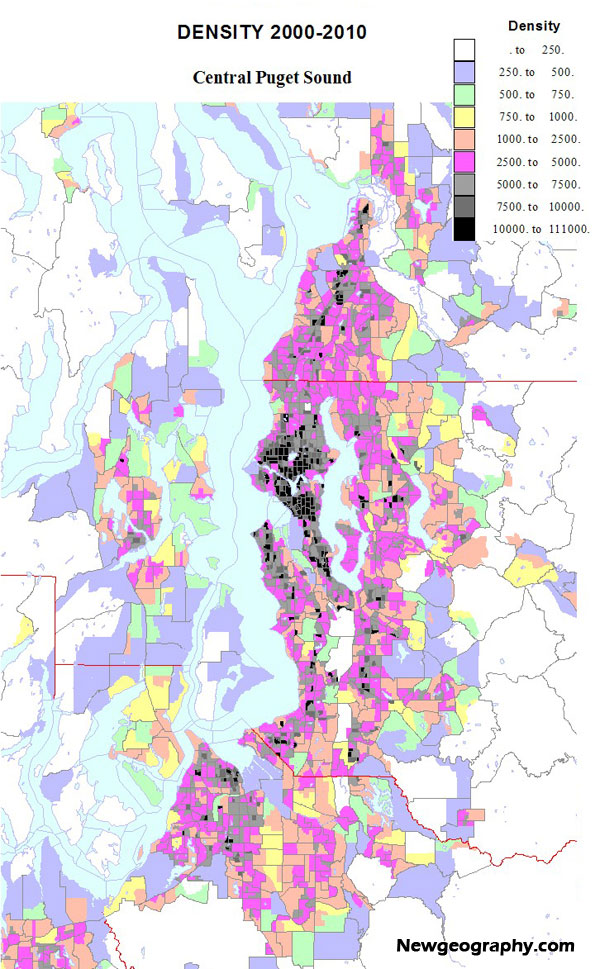
But still more than half the urban footprint resists the officially preferred urban densities. Even with densification, redevelopment and the opening of the first light rail line, these higher density areas housed only 34 percent of the population of King county (up from 32 % in 2000), and only 10 % of the population of the people of the three suburban counties. The city of Seattle is exceptional, containing 52 percent of the high density tracts on the metropolitan area, although it has only one-sixth of the population.
As the late great UW economist Charlie Tiebout told a seminar 50 years ago, “People vote with their feet” This is certainly true about residential choices. While perhaps twenty percent at most of Americans may prefer higher density living, for reasons of age, family status or ideology, the large majority does not and likely will not.
To a leftist like me, the tragedy is how smart growth transfers wealth and the vaunted “quality of life” to the rich and the professionals, at the expense of the poor and of minorities. Sadly the Democratic party seems totally blind to the fact that the fixation on new urbanism contributes to the rightward backlash. Folks do not want to be told how to live, especially, dare I assert, when those hectoring them have already cornered the nicest parts of the region for themselves. Middle and working class families are not likely to embrace policies – beloved by affluent professionals – that would deny them a chance to own their preferred kind of residence at a reasonable price.
Richard Morrill is Professor Emeritus of Geography and Environmental Studies, University of Washington. His research interests include: political geography (voting behavior, redistricting, local governance), population/demography/settlement/migration, urban geography and planning, urban transportation (i.e., old fashioned generalist).


Good Post
accident compensation claims
Very good work and much
GOOD!!!!!!!!
vintage photo booth rental
Thanks you very much for
Thanks you very much for sharing these links. Will definitely check this out..
fotografi
Changing Housing Preferences
According to housing market research, current demographic and economic trends (aging population, rising fuel prices, increasing traffic congestion, changing consumer preferences, and increasing health and environmental concerns) are increasing consumer demand for smart growth locations. This is not to say that all households want to live in multi-family homes in central city neighborhoods, but the research indicates that a growing portion of households want improved accessibility (indicated by shorter commutes), land use mix (indicated by nearby shops and services), and diverse transport options (indicated by good walking conditions and public transit services) and will often choose small-lot and attached homes that offer these features.
Households make tradeoffs between housing and transportation costs. As fuel prices increase the value of more housing in more accessible, multi-modal locations increases, particularly for lower-income households.
Dr. Morrill is therefore wrong to assume that smart growth policies necessarily harm poor and minorities. To the degree that physically, economically and socially disadvantaged people want improved accessibility and transport options they benefit directly from smart growth policies such as reduced minimum parking and setback requirements, more mixed development with public services located near residential neighborhoods, more compact and diverse housing types, more investments in alternative modes, and more affordable housing in urban areas. High housing prices in accessible urban areas indicates a shortage of supply which should be addressed by developing more such housing.
For information see:
GWL (2010), "Drivers Of Apartment Living In Canada For The Twenty-First Century," GWL Realty (www.gwlrealtyadvisors.com); at www.gwlrealtyadvisors.com/gwlra/CNTAsset/Drivers_of_21st_century_apt_living[1].pdf.
Todd Litman (2009), "Where We Want To Be: Home Location Preferences And Their Implications For Smart Growth," Victoria Transport Policy Institute (www.vtpi.org); at www.vtpi.org/sgcp.pdf.
Todd Litman (2010), "Affordable-Accessible Housing In A Dynamic City: Why and How To Support Development of More Affordable Housing In Accessible Locations," Victoria Transport Policy Institute (www.vtpi.org); at www.vtpi.org/aff_acc_hou.pdf.
Raven Molloy and Hui Shan (2011), "The Effect of Gasoline Prices on Household Location," Federal Reserve Board (https://federalreserve.gov); at https://federalreserve.gov/pubs/feds/2010/201036/201036pap.pdf.
NAR (2011), "2011 Community Preference Survey: What Americans Are Looking For When Deciding Where To Live," National Association of Realtors (www.realtor.org); at www.realtor.org/press_room/news_releases/2011/04/smart_growth.
Arthur C. Nelson (2006), “Leadership in a New Era,” Journal of the American Planning Association, Vol. 72, No. 4 (www.planning.org); at http://law.du.edu/images/uploads/rmlui/conferencematerials/2007/Thursday....
John Stillich and Sandeep Kumar Agrawal (2008), "Housing Alternatives Acceptability Study (HAAS)," Sustainable Urban Development Association (www.suda.ca); at www.trialsudasite.citymax.com/f/Final_FINAL_HAAS_Report1.pdf.
John V. Thomas (2010), "Residential Construction Trends in America's Metropolitan Regions," Development, Community, and Environment Division, U.S. Environmental Protection Agency (www.epa.gov); at www.epa.gov/smartgrowth/pdf/metro_res_const_trends_10.pdf;
ULI (Annual Reports), "Emerging Trends in Real Estate," Urban Land Institute (www.uli.org); at www.uli.org/ResearchAndPublications/EmergingTrends/Americas.aspx.
========================
Todd Litman is founder and executive director of the Victoria Transport Policy Institute (www.vtpi.org), an independent research organization dedicated to developing innovative solutions to transport problems.