
A new census leads us to ask how population has changed, but usually discussion is focused on changes since the last census. But even more interesting is to appreciate the vaster changes over a greater sweep of time, for example: the fifty years since 1960, when the United States had 179 million people, toward the end of the post-war Baby Boom.
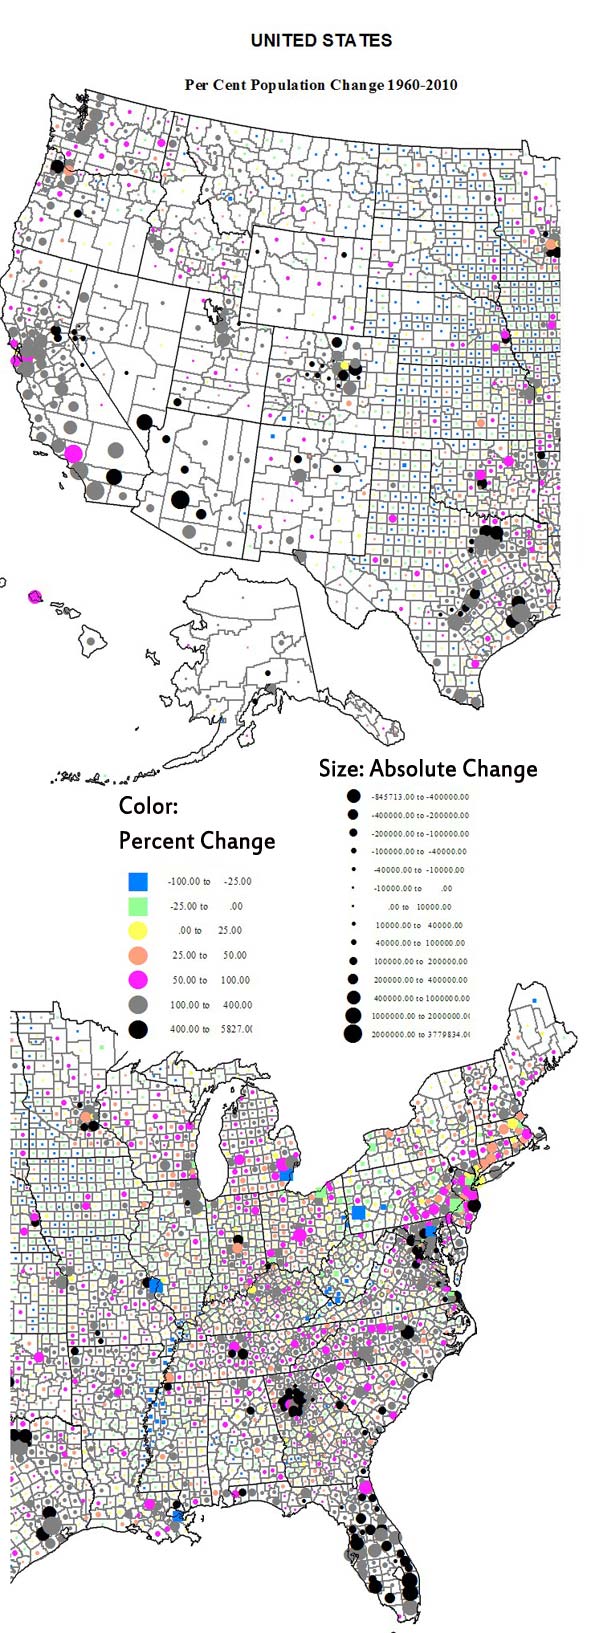
Over this fifty year period, the country experienced a tremendous economic expansion and metropolitan growth. The attatched maps and charts display these changes, both in the greatest absolute and relative (percentage) losses and gains. We can then assess areas and regions that changed the most – or the least – and how this pattern differs from the most recent decade.
Looking at both the maps and the tables, high absolute losses are in large northeastern metropolitan counties, plus, because of Katrina, Orleans (New Orleans). Next most prominent in terms of losses are mining and small industrial counties in Appalachia as well as the largely rural Black majority counties in the Mississippi delta (Arkansas and Mississippi). Far more widespread in terms of space are small absolutely but often high percentage losses across the Great Plains, the rural small town heartland of the country. Losses do extend to the west, in a few mining and farming counties, as in MT, ID, OR and WA, as well as a few Native American reservation areas.
From Table 1 (below), 12 counties lost more than 100,000 people since 1960, most in the northeastern historic urban industrial core, including two New York City boroughs. The bigger loser by far, however, was Wayne (Detroit) . Next were Philadelphia, which lost 477,000 and St. Louis, falling 57 percent from 750,000 to 319,000. Among non-metropolitan counties, the largest absolute losses were in West Virginia, Kentucky and Pennsylvania (mining), and Arkansas and Mississippi (high Black population).
High relative losses (table 2) of over 50 percent beset 69 counties, all non-metropolitan except one: St Louis. States with the greatest number of declining counties included North Dakota, 19; Texas, 16; South Dakota, 6, Kansas, Montana and Nebraska, 4; Arkansas, 3; and Missouri, 2. Most were in the Plains states. It is also clear that a high proportion of counties – both metropolitan and non metropolitan – with high Black populations have experienced losses, a sad commentary on disinvestment in areas with high African-American shares.
In contrast, the pattern of gains is more complex. Overwhelmingly, the highest absolute amounts (table 3) – and often percentage gains (table 4) – are in mostly larger metropolitan complexes. For the largest areas, the core counties often had lesser rates of growth, even if the absolute amounts were very large (e.g., Los Angeles, Cook, Dallas-Fort Worth, Houston). In contrast the highest rates of growth, often over 400 percent, took place in their satellite or suburban counties. Most obvious are greater Los Angeles and San Francisco, Denver, the large Texas metropolitan areas, Minneapolis, Chicago-Milwaukee, Atlanta, Indianapolis, Seattle, Portland and Washington, DC. More recent, less suburban (at least in terms of jurisdiction) dominated areas, often in the Sunbelt, include especially Maricopa (Phoenix), Las Vegas, Salt Lake, Nashville, Charlotte, Raleigh, and Richmond.
This leaves perhaps the two most spectacular (along with California, obviously: the northeastern Megalopolis and Florida. Florida clearly has the highest overall rate of change over this period. The northeastern Megalopolis is highly varied, but overall now spreading from Richmond, Virginia to Portland, Maine. It has developed into an astounding agglomeration of growth, with the locus of fastest absolute as well as percentage growth in its suburban and exurban portions.
Growth was also often substantial in non-metropolitan or now small metropolitan areas in many parts of the country. An especially remarkable belt of growth – including small towns – extends from Memphis across Tennessee and North Carolina. Another span of significant growth – despite decline or slower growth in the recent past – lies in the Midwest (Indiana, Ohio, Michigan, Wisconsin and Minnesota). Belts of growth follow the I-5 corridor from California to Canada, the corridor from Tulsa through Fayetteville and Springfield to St Louis, and the I95 coastal south Atlantic strip.
Sixteen counties gained a million or more: Los Angeles, Orange, San Diego, Riverside and San Bernardino, a southwestern megalopolis; Santa Clara (San Jose); Harris (Houston); Dallas and Fort Worth (Tarrant) and Bexar (San Antonio) in Texas; Miami, Ft. Lauderdale (Broward) and Palm Beach, Florida; Clark (Las Vegas); King (Seattle); and Maricopa (Phoenix).
Finally the counties which grew at the fastest rate over the 50 years include some 118 that grew by 400 percent or more, and 27 that expanded more than ten-fold. States with the most such counties (400 to 1000 % ) include Florida, 15; Georgia, 11; Colorado, 8; Texas, 6; Virginia 6; California, 4; AZ,MN, MO, NC, and NV, 3 each; MD, NM, OR, TN, WY, 2 each; with 1 each in AL, AR, AK, IL, IN, KY, LA, MS, NE, OK, PA, SC, UT and WA. Among the over 1000 percent growth, AK and AZ, 1; CO, 3; FL, 8; GA, 4; NV, 2; TX, 6; UT, 1; and VA, 1.
Types of counties with over 400 percent growth include 3 core metropolitan, 69 suburban, 44 environmental, and 2 others, often resource development. The fastest growth county was Douglas in suburban Denver, followed by environmentally attractive Mohave, AZ, and Flagler and Collier, FL, followed by Dallas suburb, Collin, and Atlanta suburb Gwinnett.
Conclusion
People continue to come to the US in large numbers, and people move from place to place in remarkable numbers. Don’t count on the current pattern of population to remain very stable, just as the last fifty years have not been. For example, while the northeastern “Rustbelt” seems in trouble, it is a region of vast plant capacity, superior universities, and a high quality labor force. A reaction to the high cost of excessive outsourcing, and even some shifts from the “new South” could bring about a surprising restoration.
| Table 1: Largest Absolute Losses, 1960-2010 | ||||||
|
Name
|
1900
|
1960
|
2000
|
2010
|
Change 1960-2010
|
Percent Change, 1960-2010
|
| MI Wayne County | 348,793 | 2,666,297 | 2,061,162 | 1,820,584 | -845,713 | -31.7% |
| PA Philadelphia County | 1,293,697 | 2,002,512 | 1,517,550 | 1,526,006 | -476,506 | -23.8% |
| MO St. Louis city | 575,238 | 750,026 | 348,189 | 319,294 | -430,732 | -57.4% |
| PA Allegheny County | 775,058 | 1,628,587 | 1,281,666 | 1,223,348 | -405,239 | -24.9% |
| OH Cuyahoga County | 439,120 | 1,647,895 | 1,393,978 | 1,280,122 | -367,773 | -22.3% |
| MD Baltimore city | 508,957 | 939,024 | 651,154 | 620,961 | -318,063 | -33.9% |
| LA Orleans Parish | 287,104 | 627,525 | 484,674 | 343,829 | -283,696 | -45.2% |
| DC District of Columbia | 278,718 | 763,956 | 572,059 | 601,723 | -162,233 | -21.2% |
| NY Erie County | 433,686 | 1,064,688 | 950,265 | 919,040 | -145,648 | -13.7% |
| NJ Essex County | 359,053 | 923,545 | 793,633 | 783,969 | -139,576 | -15.1% |
| NY Kings County | 1,166,582 | 2,627,319 | 2,465,326 | 2,504,700 | -122,619 | -4.7% |
| NY New York County | 2,050,600 | 1,698,281 | 1,537,195 | 1,585,873 | -112,408 | -6.6% |
| WI Milwaukee County | 330,017 | 1,036,041 | 940,164 | 947,735 | -88,306 | -8.5% |
| MA Suffolk County | 611,417 | 791,329 | 689,807 | 722,023 | -69,306 | -8.8% |
| VA Norfolk city | 46,624 | 305,872 | 234,403 | 242,803 | -63,069 | -20.6% |
| OH Hamilton County | 409,479 | 864,121 | 845,303 | 802,374 | -61,747 | -7.1% |
| OH Mahoning County | 70,134 | 300,480 | 257,555 | 238,823 | -61,657 | -20.5% |
| WV Kanawha County | 54,696 | 252,925 | 200,073 | 193,063 | -59,862 | -23.7% |
| PA Cambria County | 104,837 | 203,283 | 152,598 | 143,679 | -59,604 | -29.3% |
| Table 2: Greatest Relative Losses 1960-2010 | ||||||
|
Name
|
1900
|
1960
|
2000
|
2010
|
Change 1960-2010
|
Percent Change, 1960-2010
|
| ND Sheridan County | - | 4,350 | 1,710 | 1,321 | -3,029 | -69.6% |
| WV McDowell County | 18,747 | 71,359 | 27,329 | 22,113 | -49,246 | -69.0% |
| HI Kalawao County | 1,177 | 279 | 147 | 90 | -189 | -67.7% |
| ND Burke County | - | 5,886 | 2,242 | 1,968 | -3,918 | -66.6% |
| TX Cottle County | 1,002 | 4,207 | 1,904 | 1,505 | -2,702 | -64.2% |
| TX Loving County | 33 | 226 | 67 | 82 | -144 | -63.7% |
| ND Logan County | 1,625 | 5,369 | 2,308 | 1,990 | -3,379 | -62.9% |
| NM Harding County | - | 1,874 | 810 | 695 | -1,179 | -62.9% |
| ND Divide County | - | 5,566 | 2,283 | 2,071 | -3,495 | -62.8% |
| TX Terrell County | - | 2,600 | 1,081 | 984 | -1,616 | -62.2% |
| CO La Plata County | 7,016 | 19,225 | 43,941 | 7,310 | -11,915 | -62.0% |
| ND Grant County | - | 6,248 | 2,841 | 2,394 | -3,854 | -61.7% |
| ND Slope County | - | 1,893 | 767 | 727 | -1,166 | -61.6% |
| MS Quitman County | 5,435 | 21,019 | 10,117 | 8,223 | -12,796 | -60.9% |
| ND Hettinger County | - | 6,317 | 2,715 | 2,477 | -3,840 | -60.8% |
| MS Issaquena County | 10,400 | 3,576 | 2,274 | 1,406 | -2,170 | -60.7% |
| ND Cavalier County | 12,580 | 10,064 | 4,831 | 3,993 | -6,071 | -60.3% |
| ND Towner County | 6,491 | 5,624 | 2,876 | 2,246 | -3,378 | -60.1% |
| SD Campbell County | 4,527 | 3,531 | 1,782 | 1,466 | -2,065 | -58.5% |
| ND Steele County | 5,888 | 4,719 | 2,258 | 1,975 | -2,744 | -58.1% |
| ND McIntosh County | 4,818 | 6,702 | 3,390 | 2,809 | -3,893 | -58.1% |
| ND Emmons County | 4,349 | 8,462 | 4,331 | 3,550 | -4,912 | -58.0% |
| TX Motley County | 1,257 | 2,870 | 1,426 | 1,210 | -1,660 | -57.8% |
| SD McPherson County | 6,327 | 5,821 | 2,904 | 2,459 | -3,362 | -57.8% |
| MO St. Louis city | 575,238 | 750,026 | 348,189 | 319,294 | -430,732 | -57.4% |
| Table 3: Largest Absolute Gains, 1960-2010 | ||||||
|
Name
|
1900
|
1960
|
2000
|
2010
|
Change 1960-2010
|
Percent Change, 1960-2010
|
| CA Los Angeles County | 170,298 | 6,038,771 | 9,519,338 | 9,818,605 | 3,779,834 | 63% |
| AZ Maricopa County | 20,457 | 663,510 | 3,072,149 | 3,817,117 | 3,153,607 | 475% |
| TX Harris County | 63,786 | 1,243,158 | 3,400,578 | 4,092,459 | 2,849,301 | 229% |
| CA Orange County | 19,696 | 703,925 | 2,846,289 | 3,010,232 | 2,306,307 | 328% |
| CA San Diego County | 35,090 | 1,033,011 | 2,813,833 | 3,095,313 | 2,062,302 | 200% |
| CA Riverside County | 17,897 | 306,191 | 1,545,387 | 2,189,641 | 1,883,450 | 615% |
| NV Clark County | - | 127,016 | 1,375,765 | 1,951,269 | 1,824,253 | 1436% |
| FL Dade County | 4,955 | 935,047 | 2,253,362 | 2,496,435 | 1,561,388 | 167% |
| CA San Bernardino County | 27,929 | 503,591 | 1,709,434 | 2,035,210 | 1,531,619 | 304% |
| TX Dallas County | 82,726 | 951,527 | 2,218,899 | 2,368,139 | 1,416,612 | 149% |
| FL Broward County | - | 333,946 | 1,623,018 | 1,748,066 | 1,414,120 | 423% |
| TX Tarrant County | 52,376 | 538,495 | 1,446,219 | 1,809,034 | 1,270,539 | 236% |
| CA Santa Clara County | 60,216 | 642,315 | 1,682,585 | 1,781,642 | 1,139,327 | 177% |
| FL Palm Beach County | - | 228,106 | 1,131,184 | 1,320,134 | 1,092,028 | 479% |
| TX Bexar County | 69,422 | 687,151 | 1,392,931 | 1,714,773 | 1,027,622 | 150% |
| WA King County | 110,053 | 935,014 | 1,737,034 | 1,931,249 | 996,235 | 107% |
| CA Sacramento County | 45,915 | 502,778 | 1,223,499 | 1,418,788 | 916,010 | 182% |
| FL Orange County | 11,374 | 263,540 | 896,344 | 1,145,956 | 882,416 | 335% |
| FL Hillsborough County | 36,013 | 397,788 | 998,948 | 1,229,226 | 831,438 | 209% |
| NY Suffolk County | 77,582 | 666,784 | 1,419,369 | 1,493,350 | 826,566 | 124% |
| TX Travis County | 47,386 | 212,136 | 812,280 | 1,024,266 | 812,130 | 383% |
| VA Fairfax County | 18,580 | 275,002 | 969,749 | 1,081,726 | 806,724 | 293% |
| GA Gwinnett County | 25,585 | 43,541 | 588,448 | 805,321 | 761,780 | 1750% |
| TX Collin County | 50,087 | 41,247 | 491,675 | 782,341 | 741,094 | 1797% |
| NC Wake County | 54,626 | 169,082 | 627,846 | 900,993 | 731,911 | 433% |
| AZ Pima County | 14,689 | 265,660 | 843,746 | 980,263 | 714,603 | 269% |
| NC Mecklenburg County | 55,268 | 272,111 | 695,454 | 919,628 | 647,517 | 238% |
| UT Salt Lake County | 77,725 | 383,035 | 898,387 | 1,029,655 | 646,620 | 169% |
| Table 4: Largest Relative Gains, 1960-2010 | ||||||
|
Name
|
1900
|
1960
|
2000
|
2010
|
Change 1960-2010
|
Percent Change, 1960-2010
|
| CO Douglas County | 3,120 | 4,816 | 175,766 | 285,465 | 280,649 | 5827% |
| AZ Mohave County | 3,426 | 7,736 | 155,032 | 200,186 | 192,450 | 2488% |
| FL Flagler County | - | 4,566 | 49,832 | 95,696 | 91,130 | 1996% |
| FL Collier County | - | 15,753 | 251,377 | 321,520 | 305,767 | 1941% |
| TX Collin County | 50,087 | 41,247 | 491,675 | 782,341 | 741,094 | 1797% |
| GA Gwinnett County | 25,585 | 43,541 | 588,448 | 805,321 | 761,780 | 1750% |
| AK Matanuska-Susitna Borough | - | 5,188 | 59,322 | 88,995 | 83,807 | 1615% |
| TX Montgomery County | 17,067 | 26,839 | 293,768 | 455,746 | 428,907 | 1598% |
| FL Hernando County | 3,638 | 11,205 | 130,802 | 172,778 | 161,573 | 1442% |
| NV Clark County | - | 127,016 | 1,375,765 | 1,951,269 | 1,824,253 | 1436% |
| FL Citrus County | 5,391 | 9,268 | 118,085 | 141,236 | 131,968 | 1424% |
| TX Fort Bend County | 16,538 | 40,527 | 354,452 | 585,375 | 544,848 | 1344% |
| GA Forsyth County | 11,550 | 12,170 | 98,407 | 175,511 | 163,341 | 1342% |
| FL Osceola County | 3,444 | 19,029 | 172,493 | 268,685 | 249,656 | 1312% |
| TX Denton County | 28,318 | 47,432 | 432,976 | 662,614 | 615,182 | 1297% |
| CO Summit County | 2,744 | 2,073 | 23,548 | 27,994 | 25,921 | 1250% |
| NV Douglas County | 1,534 | 3,481 | 41,259 | 46,997 | 43,516 | 1250% |
| UT Washington County | 4,612 | 10,271 | 90,354 | 138,115 | 127,844 | 1245% |
| TX Rockwall County | 8,531 | 5,878 | 43,080 | 78,337 | 72,459 | 1233% |
| GA Fayette County | 10,114 | 8,199 | 91,263 | 106,567 | 98,368 | 1200% |
| VA Loudoun County | 21,948 | 24,549 | 169,599 | 312,311 | 287,762 | 1172% |
| FL Charlotte County | - | 12,594 | 141,627 | 159,978 | 147,384 | 1170% |
| FL Pasco County | 6,054 | 36,785 | 344,765 | 464,697 | 427,912 | 1163% |
| TX Williamson County | 38,072 | 35,044 | 249,967 | 422,679 | 387,635 | 1106% |
| GA Henry County | 18,602 | 17,619 | 119,341 | 203,922 | 186,303 | 1057% |
| FL Lee County | 3,071 | 54,539 | 440,888 | 618,754 | 564,215 | 1035% |
Richard Morrill is Professor Emeritus of Geography and Environmental Studies, University of Washington. His research interests include: political geography (voting behavior, redistricting, local governance), population/demography/settlement/migration, urban geography and planning, urban transportation (i.e., old fashioned generalist).


Key
Richard
I'm a little confused about the key for Absolute Change. How do you distinguish the negatives from the positives?
Ian Abley
www.audacity.org
Jean Gottmann's insight
Richard
You appear to accept as true Jean Gottmann's argument from 1961 that the North Eastern Seaboard of the US was already a Megalopolis. I think you are right to do so.
Do you see other megalopoli in the US developing since 1960?
Where can I read more of your work?
Peter Hall has long denied that there is a megalopolis across the South East of England, radiating out from and orbiting around Greater London, and Inner London at it's core. He denies this despite the evidence of the 2001 census, which after the 2011 census is digested will show how "London" is no longer contained by the conventional administrative boundaries, even though the Green Belt persists as an attempt to resist megalopolitan sprawl.
Do you have any research on Britain?
Ian Abley
www.audacity.org
"Land" is a factor of production, remember?
".....while the northeastern “Rustbelt” seems in trouble, it is a region of vast plant capacity, superior universities, and a high quality labor force. A reaction to the high cost of excessive outsourcing, and even some shifts from the “new South” could bring about a surprising restoration....."
I keep trying to point out on forums all over the world, that low land prices are an advantage and high land prices are a disadvantage, to the economy concerned. I fully agree that the rustbelt will rebound economically, as long as the cities concerned don't start to go in for prescriptive urban planning.
Some parts of Britain have massively high long term unemployment AND prescriptive planning and unaffordable land prices which act as a barrier to any recovery happening.
It is also important that the unions learn their lesson about gouging an important industry to death.
Conflation
Phil
You conflate the post-1947 planning system with the efforts of unionised labour.
The post-1947 planning system may annoy employers wanting cheap land, just as trade unions (when they do not compromise and collapse) annoy employers by insisting on wage rates and conditions.
However the post-1947 planning system was (and remains) a containment of the workforce, denying the majority access to cheap land on which to live at lower costs. Employers and government sought to contain the workforce, directing post war reconstruction to the old centres or to the new towns where production was distributed. That operated up to the 1960s, from which point Britain's economy went into decline.
Employers in Britain have long been adept at relocating to parts of the world where they can buy the factors of production, like land and labour, more cheaply. They have never been willing to get rid of the post-1947 planning system that contained their own workforce.
Now too, much of British capital (£1.2 trillion) is tied up in lending to the contained workforce who have come to rely on mortgage financed owner occupation for their housing. Employers and government have long ago given up on the idea that they should provide cheap housing for rent to the workforce.
So don't conflate the self-interest of the workforce in trade unionism (as painful but ineffective as it has been) with the containment of the workforce through a planning system than no employer's organisation or government (even this Coalition) will contemplate doing without.
British capitalism has many interests that are protected by the post-1947 planning system.
It is not regulation per-se that matters, but whose interests are being served that are important. Far better to have the Factory Acts than not...
Ian Abley
www.audacity.org