
The National Bureau of Statistics of China has just released the first results of the 2010 census. The new figures portray a radically reduced population growth rate, rapid urbanization and an unprecedented domination of population growth by the East Coast.
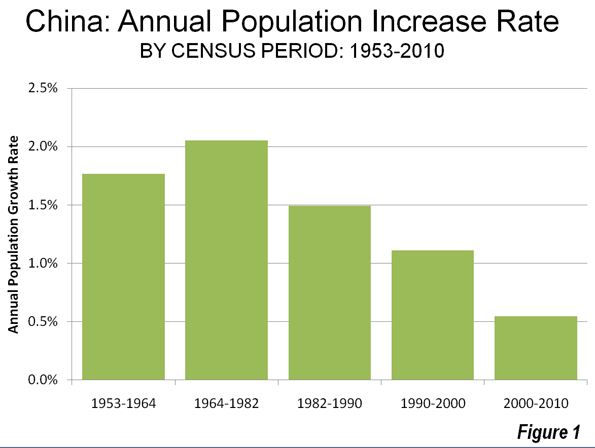
Slowing Population Growth: China, the world's most populous nation, grew rapidly until the early 1980s. The strongest growth since 1950 was in the 1964 to 1982 census period, during which the annual growth rate exceeded two percent. By the 1990 to 2000 period, the annual rate had fallen to 1.1 percent and then dropped in half to approximately 0.6 percent between 2000 and 2010 (Figure 1). The nation's total population growth between 2000 and 2010 was approximately 75 million. In contrast, the 1964 to 1982 rate would have produced a population increase of 300 million people. Two key factors have influenced this drop in population growth rate. The first is rapidly improving affluence, a factor routinely associated with lower birth rates around the world. The second factor is China's one child policy, which is contributing to an aging of the population and has been associated with an increasing male to female birth ratio.
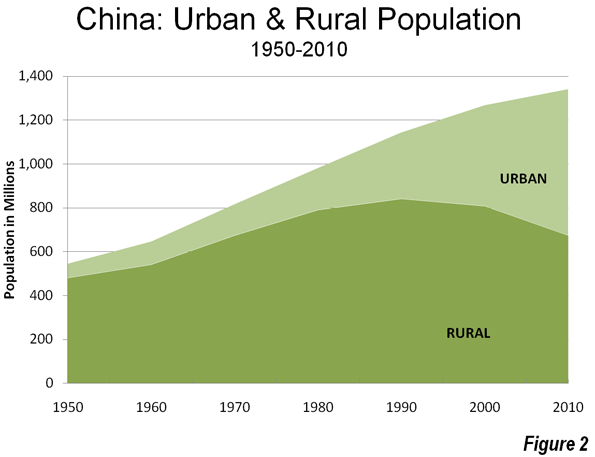
Accelerating Urbanization: Between 2000 and 2010, China continued to urbanize at a pace and scale never seen before in world history (Figure 2). China added approximately 205 million urban residents over 10 years, more urban residents than live in any country except for India and the United States. China's urban population expansion was 2.5 times the estimated increase in rapidly urbanizing India. In 2010, nearly 50 percent of the population lived in urban areas, compared to 37 percent in 2000. This increase is well above expectations. The United Nations had projected an urbanization share of 47 percent, which would have converted to approximately 50 million fewer urban residents.
A large share of the increase in urban population was from the nation's large migrant population, which lacks registration (hukou status) at its current, generally urban place of residence. A floating population, this group rose from 120 million in 2000 to 220 million in 2010. This movement of 100 million people dwarfs the national population increase of 75 million. Previous data indicated that virtually all of Shanghai's population growth was due to migration of (principally poorer) people from elsewhere, as has occurred elsewhere in the nation.
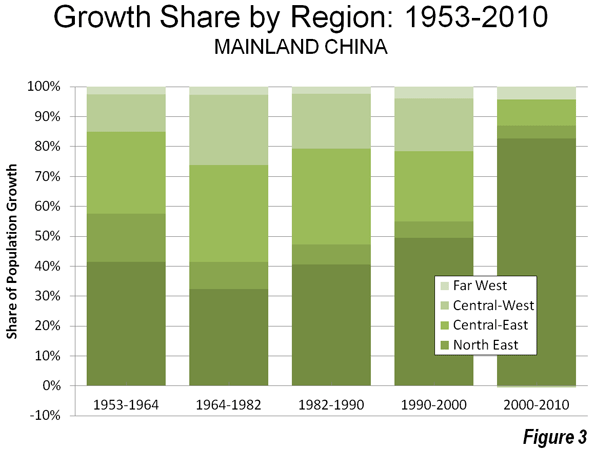
Moving East: For the first time since 1950, one region of the nation was dominant (Figure 3), with 83 percent of growth on the already heavily urbanized East Coast. In contrast, the center (East Central and West Central regions) combined for only eight percent of the growth, which is down from 41 percent between 1990 and 2000 and 56 percent between 1964 and 1982 (Note 1) Regional and provincial level population trends are indicated in the table below (link to provincial level map).
| China Population Trends by Region & Province | |||||||
| 1990-2010 | |||||||
| 1990 | 2000 | 2010 | 1990-2000 Change | 2000-2010 Change | Share of Growth: 1990-2000 | Share of Growth: 2000-2010 | |
| CHINA | 1,130.49 | 1,262.28 | 1,332.77 | 11.7% | 5.6% | 100.0% | 100.0% |
| EAST COAST | 428.61 | 493.84 | 552.20 | 15.2% | 11.8% | 49.5% | 82.8% |
| NORTH | 165.08 | 182.06 | 200.20 | 10.3% | 10.0% | 12.9% | 25.7% |
| Beijing | 10.82 | 13.82 | 19.61 | 27.7% | 41.9% | 2.3% | 8.2% |
| Hebei | 61.08 | 67.44 | 71.85 | 10.4% | 6.5% | 4.8% | 6.3% |
| Shandong | 84.39 | 90.79 | 95.79 | 7.6% | 5.5% | 4.9% | 7.1% |
| Tianjin | 8.79 | 10.01 | 12.94 | 13.9% | 29.3% | 0.9% | 4.2% |
| CENTRAL | 151.89 | 172.60 | 193.00 | 13.6% | 11.8% | 15.7% | 28.9% |
| Fujian | 30.05 | 34.71 | 36.89 | 15.5% | 6.3% | 3.5% | 3.1% |
| Jiangsu | 67.06 | 74.38 | 78.66 | 10.9% | 5.8% | 5.6% | 6.1% |
| Shanghai | 13.34 | 16.74 | 23.02 | 25.5% | 37.5% | 2.6% | 8.9% |
| Zhejiang | 41.45 | 46.77 | 54.43 | 12.8% | 16.4% | 4.0% | 10.9% |
| SOUTH | 111.63 | 139.18 | 159.00 | 24.7% | 14.2% | 20.9% | 28.1% |
| Guangdong | 62.83 | 86.42 | 104.30 | 37.5% | 20.7% | 17.9% | 25.4% |
| Guangxi | 42.25 | 44.89 | 46.03 | 6.3% | 2.5% | 2.0% | 1.6% |
| Hainan | 6.56 | 7.87 | 8.67 | 20.0% | 10.2% | 1.0% | 1.1% |
| NORTH EAST | 99.33 | 106.55 | 109.52 | 7.3% | 2.8% | 5.5% | 4.2% |
| Heilongjiang | 35.21 | 36.89 | 38.31 | 4.8% | 3.9% | 1.3% | 2.0% |
| Jilin | 24.66 | 27.28 | 27.46 | 10.6% | 0.7% | 2.0% | 0.3% |
| Liaoning | 39.46 | 42.38 | 43.75 | 7.4% | 3.2% | 2.2% | 1.9% |
| EAST CENTRAL | 344.25 | 375.23 | 381.43 | 9.0% | 1.7% | 23.5% | 8.8% |
| NORTH | 106.40 | 116.59 | 119.92 | 9.6% | 2.9% | 7.7% | 4.7% |
| Anhui | 56.18 | 59.86 | 59.50 | 6.5% | -0.6% | 2.8% | -0.5% |
| Inner Mongolia | 21.46 | 23.76 | 24.71 | 10.7% | 4.0% | 1.7% | 1.3% |
| Shanxi | 28.76 | 32.97 | 35.71 | 14.6% | 8.3% | 3.2% | 3.9% |
| SOUTH | 237.85 | 258.64 | 261.51 | 8.7% | 1.1% | 15.8% | 4.1% |
| Henan | 85.51 | 92.56 | 94.02 | 8.2% | 1.6% | 5.3% | 2.1% |
| Hubei | 53.97 | 60.28 | 57.24 | 11.7% | -5.0% | 4.8% | -4.3% |
| Hunan | 60.66 | 64.40 | 65.68 | 6.2% | 2.0% | 2.8% | 1.8% |
| Jiangxi | 37.71 | 41.40 | 44.57 | 9.8% | 7.7% | 2.8% | 4.5% |
| WEST CENTRAL | 236.49 | 259.61 | 259.18 | 9.8% | -0.2% | 17.5% | -0.6% |
| NORTH | 59.91 | 67.29 | 69.20 | 12.3% | 2.8% | 5.6% | 2.7% |
| Gansu | 22.37 | 25.62 | 25.58 | 14.5% | -0.2% | 2.5% | -0.1% |
| Ningxia | 4.66 | 5.62 | 6.30 | 20.7% | 12.1% | 0.7% | 1.0% |
| Shaanxi | 32.88 | 36.05 | 37.33 | 9.6% | 3.5% | 2.4% | 1.8% |
| SOUTH | 176.58 | 192.32 | 189.98 | 8.9% | -1.2% | 11.9% | -3.3% |
| Chongqing | 28.86 | 30.90 | 28.85 | 7.1% | -6.6% | 1.5% | -2.9% |
| Guizhou | 32.39 | 35.25 | 34.75 | 8.8% | -1.4% | 2.2% | -0.7% |
| Sichuan | 78.36 | 83.29 | 80.42 | 6.3% | -3.4% | 3.7% | -4.1% |
| Yunnan | 36.97 | 42.88 | 45.97 | 16.0% | 7.2% | 4.5% | 4.4% |
| FAR WEST | 21.81 | 27.05 | 30.44 | 24.0% | 12.5% | 4.0% | 4.8% |
| Qinghai | 4.46 | 5.18 | 5.63 | 16.2% | 8.6% | 0.5% | 0.6% |
| Tibet | 2.20 | 2.62 | 3.00 | 19.3% | 14.6% | 0.3% | 0.5% |
| Xinjiang | 15.16 | 19.25 | 21.81 | 27.0% | 13.3% | 3.1% | 3.6% |
East Coast: The East Coast growth share of 83 percent is far higher than in previous census periods, which reached a high at 49 percent between 1990 and 2000. The share of growth was consistent within the sub-regions of the East Coast. The North, surrounding Beijing and the Yellow River (Huang He) Delta, accounted for 26 percent of the growth. The Central East Coast, with Shanghai and the Yangtze River (Changjiang) Delta at its core, captured 29 percent of the growth. The South, centering on the Pearl River Delta, and the megacities of Guangzhou, Shenzhen and Dongguan, accounted for 28 percent of the growth (Note 2).
All of the 11 provincial level jurisdictions (Note 3) on the East Coast all except for Guangxi grew at least as fast as the nation. The fastest growth in the nation was in the three provincial level municipalities: Beijing, where the population increased 42 percent, Shanghai at 38 percent and Tianjin at 29 percent. Even so, Beijing's population was a full two million less than some estimates, while Shanghai's was nearly one million more than current city estimates.
Outside the provincial level municipalities, Guangdong was the fastest growing in the nation, adding 21 percent. Guangdong became the nation's largest provincial level jurisdiction, reaching 104 million and adding 18 million new residents. The Guangdong count was particularly surprising, roughly 7 million higher than would have been expected based upon 2009 population estimates. Zhejiang, adjacent to Shanghai grew 16 percent. Hainan, an island province carved from Guangdong in the 1980s, grew 10 percent.
North East: The North East ("Manchuria" or "Dong Bei") accounted for only four percent of the nation's growth, down significantly from previous census periods. All three provinces grew at lower rates than the nation. These are traditional manufacturing areas that have not seen the sort of investment seen further south.
East Central: The East Central provinces accounted for eight percent of the nation's growth, down from 23 percent between 1990 and 2000. Among the seven provinces, only Shanxi and Jiangxi grew faster than the national rate. Hubei, home of Wuhan, one of the nation's largest urban areas, experienced a loss of more five percent, the second largest population decline in the nation after Chongqing. The northern East Central jurisdictions grew at approximately one half the national rate, while the south grew at approximately one fifth the national rate.
West Central: The seven West Central provincial level jurisdictions lost population in an amount equal to -0.6 percent of the national growth. This compares to an18 percent share of national growth between 1990 and 2000. The provincial level municipality of Chongqing experienced the largest rate of population loss in the nation at seven percent. Sichuan, from which Chongqing was carved in the 1990s, lost three percent of its population. Nonetheless, two provincial level jurisdictions in the West Central grew faster than the national rate, Ningxia and Yunnan. As in the East Central, the North grew at approximately one half the national rate. The South experienced heavy rural population losses, even as large urban areas, such as Chongqing and Chengdu experienced strong population gains.
Far West: The jurisdictions of the Far West captured five percent of the national growth. The Far West grew the fastest among the regions, at 12.5 percent compared to 11.8 percent on the East Coast. Each of the jurisdictions, Xinjiang, Tibet and Qinghai grew more quickly than the national rate. Nonetheless, with such a small population (30 million), the population growth in the Far West was barely one-half that of Beijing or Shanghai and little more than Tianjin.
Provincial Losses, Urban Gains: Despite the uneven concentration of growth on the East Coast, the larger increase in (100 million) in migration from rural to urban areas led to a less uneven distribution of urban growth. The slow growth and even the population losses occurring in the interior mask huge growth in major urban areas of the same provincial level jurisdictions.
Based upon 2009 estimates (provincial level urban data has not yet been released for 2010), the provincial level municipality of Chongqing gained 4.5 million urban residents (more than the population of Berlin), while the overall provincial level population loss was 2 million from 2000 to 2010. This illustrates one of the principal dynamic of population trends in China, as the countryside loses population to urban areas not only on the East Coast but also in the same general areas. The rural areas of Chongqing, which accounted for two-thirds of the population, lost more than 6 million residents, principally to the nearby Chongqing urban area as well as to other urban areas of the nation.
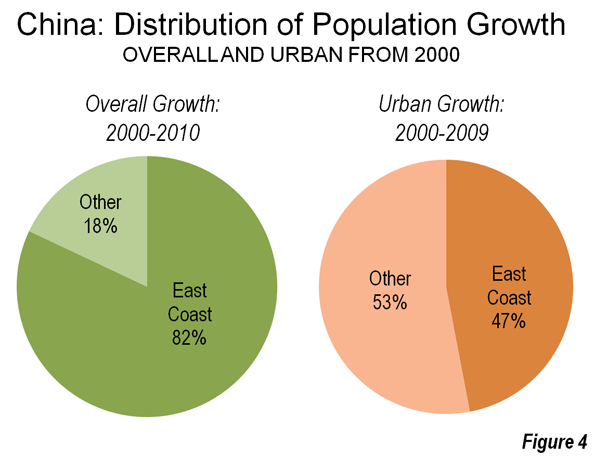
In Sichuan, with its large and fast growing capital Chengdu, the urban population grew nearly 10 million, while the provincial population was declining 3 million, indicating a rural loss of 13 million. Thus, while the East Coast accounted for 83 percent of the overall population growth, government estimates through 2009 indicate that only 47 percent of the urban population growth was on the East Coast (Figure 4).
Challenges: China faces no shortage of demographic challenges. An aging population will impose significant financial burdens on the generations to come, as is already happening in more affluent nations. The ratio of female to male births needs to be improved or social stability could be difficult to maintain in the decades ahead. The role of China's one-child policy in these issues is now being debated and reviewed.
The strong trend toward urbanization will continue for decades. The United Nations estimates that China will be nearly 75 percent urbanized in 2050 compared to the current 50 percent. The nation is expected to add 70 million residents, with an increase of 400 million in urban areas and a loss of 330 million in rural areas. Should these projections be reached, China's rate of urbanization will be near the current levels in the affluent West. Even with more than one-half of urban growth now occurring outside the East Coast, there is a need to decentralize more of the growth to the emerging urban areas of the interior. This is something now widely recognized within Chinese planning and government circles.
-----
Photo: Wuhan (capital of Hubei) By author
Note 1: There are various methods to categorize the regions of China. This classification is used to illustrate the differences in regional growth rates in the census periods since 1950. The provincial level municipality of Beijing is classified as East Coast because it is surrounded by provincial level jurisdictions (Hebei and Tianjin) which are coastal. Inner Mongolia, which stretches across the entire center of the nation is classified in the East Central because its population is more concentrated in that area. The regional population change between 1953 and 1964 includes an estimated allocation of population to provincial level jurisdictions into which abolished provinces (Rehe, or Jehol and Xikang) were merged during the period.
Note 2: The Hong Kong and Macao Special Administrative Regions are also in the south, but are not included in the 2010 census data.
Note 3: There are three types of provincial level jurisdictions in China, provinces, provincial level municipalities and autonomous regions.
Wendell Cox is a Visiting Professor, Conservatoire National des Arts et Metiers, Paris and the author of “War on the Dream: How Anti-Sprawl Policy Threatens the Quality of Life”


