
There is an expectation in some quarters that densification of existing urban areas will lead to improved housing affordability. This argument is used to justify densification policies around the world. However, an examination housing affordability and the density of built-up urban areas corresponding to the 53 major US markets (metropolitan areas over 1,000,000 population) suggests just the opposite — that higher urban densities are associated with worse housing affordability, for both owners and renters.
This analysis uses the median multiple (median house value divided by median household income) from the latest American Community Survey (ACS) for 2019, the last pre-pandemic year and urban area densities (Note 1). The median multiple has been used in all 17 annual Demographia International Housing Affordability reports (Figure 1), which includes housing affordability categories by housing market (metropolitan area).
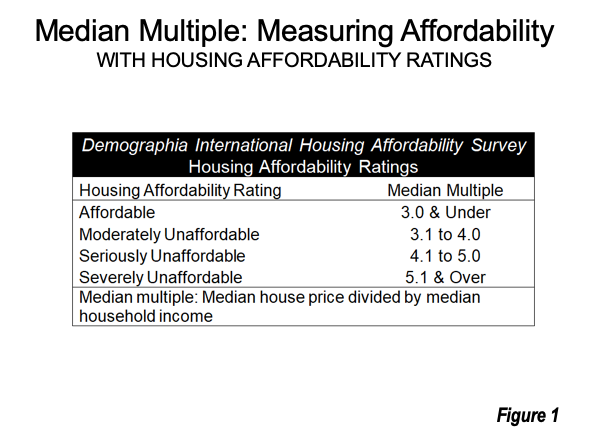
Land Use Regulation and Housing Affordability Deterioration
These housing affordability ratings are based on price-to-income ratios that existed before more restrictive land use and housing regulation was adopted in recent decades. Economic research has associated worsened housing affordability with the stronger land use regulation in many markets (metropolitan areas). Some of the most prominent research has been by Paul Cheshire and Christian Hilber at the London School of Economics, Edward Glaeser at Harvard University and Joseph Gyourko at the University of Pennsylvania and others.
For example, in 1969, before adoption of the highly restrictive regulation, the median multiples in San Jose, San Francisco and Los Angeles were 2.4, 2.7 and 2.6 respectively — 20% to 35% more costly relative to incomes than the national average. By 2020, each of these California markets had reached more than three times their earlier median multiples and each were far less affordable than average.
Housing Affordability by Urban Density Major US Markets
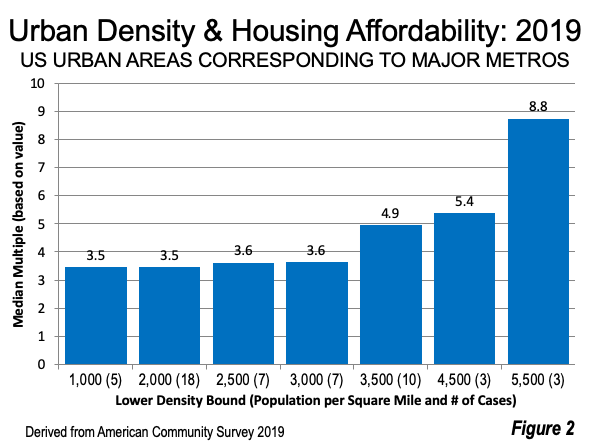
Housing affordability measures (median multiple) are indicated by urban population density in Figure 2. All urban density categories under 3,500 per square mile have median multiples of from 3.5 to 3.6, which indicates “moderately unaffordable” housing. From 3,500 density up, housing affordability drops sometimes, dramatically. Urban areas with densities from 3,500 to 4,499 per square mile have seriously unaffordable housing, at 4.9, while those from and 4,500 to 5,499 have “severely unaffordable” housing at 5.4. Urban areas with densities of 5,500 per square mile have even more severely unaffordable housing, at 8.8 (Note 2). This category includes Los Angeles, San Francisco, and San Jose.
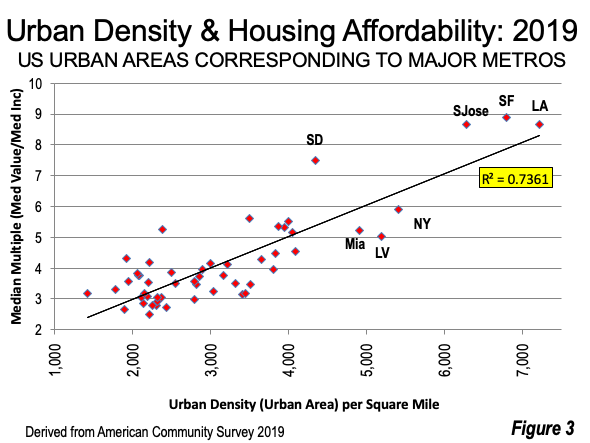
There is a strong association between urban density and housing affordability, such that affordability is better where urban densities are lower. There is a positive correlation of +0.858 (1.000 would be perfect correlation). The coefficient of determination (r2 or R squared) is 0.736, indicating that a 74% increase in the median multiple is associated with a 100% increase in urban density. This is a robust relationship — illustrated by statistical significance at the 99% confidence level (Figure 3).
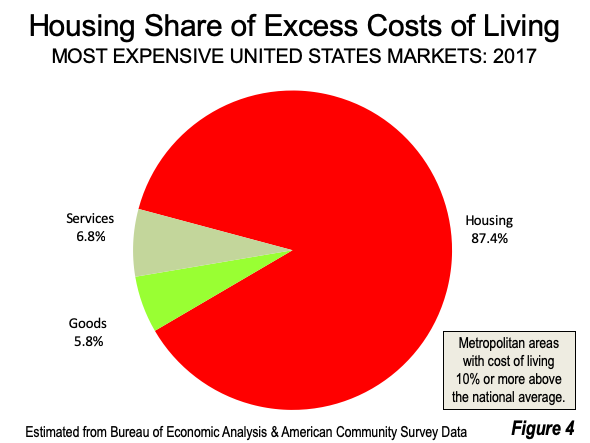
Housing affordability is important, accounting for more than 85% of the difference between higher cost markets and average markets (Figure 4).
Densification and Its Critics
Densification has its academic critics. Andrés Rodríguez-Pose (London School of Economics) and Michael Storper (UCLA) have concluded that there is insufficient evidence that “upzoning” (an important densification strategy) can improve housing affordability and that it could “increase gentrification within prosperous regions and would not appreciably decrease income inequality.”
Patrick Condon of the University of British Columbia has shown that densification in the city of Vancouver has not improved housing affordability. Condon had been an eloquent advocate of densification but describes how the “indisputable” evidence convinced him to the contrary (Note 2). Condon also provides a reminder that “upzoning” increases the value of land (by increasing the development value).
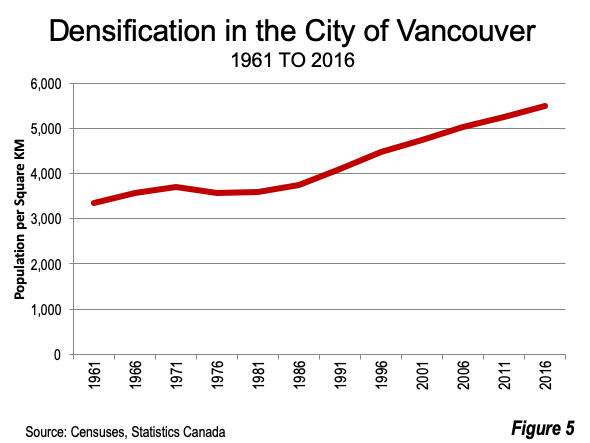
The city of Vancouver case may be the most compelling in demonstrating densification’s limits. No fully built-out major urban core municipality in North America or Western Europe has densified to the same extent as Vancouver. By 1961, Vancouver was fully built-out and had a population of 385,000. In 2016, the population was 631,000 (in virtually the same land area), an increase of more than 60% in both urban density and population from 1961 (Figure 5).
Meanwhile, housing affordability had deteriorated materially in the Vancouver area market (which includes the city and suburbs), with the median house price (all forms of owned housing) being 13.0 times the median household income in 2020. This is more than three times its 1971 affordability (3.9), and up from 5.3 in 2004.Vancouver has second worst housing affordability among the 92 major markets covered by Demographia International Housing Affordability 2021, trailing only Hong Kong.
Urban Containment
At the same time, a number of the least affordable metros have urban containment, with its much stronger restrictions or even prohibitions on urban fringe housing development, which elevate land values (see below)
Urban containment applies to entire housing markets (metropolitan areas). This is to be contrasted with municipal zoning regulations, which apply only in single municipalities (principally incorporated cities and towns). There are, on average, more than 120 municipalities within each of the 53 major metropolitan areas, based on the 2012 US Census of Governments.
All of California’s major markets have urban containment. This includes coastal Los Angeles, San Francisco, San Diego and San Jose, and inland Riverside-San Bernardino and Sacramento. Beyond California, there are other major markets with urban containment, such as Seattle, Portland, Denver, and Miami.
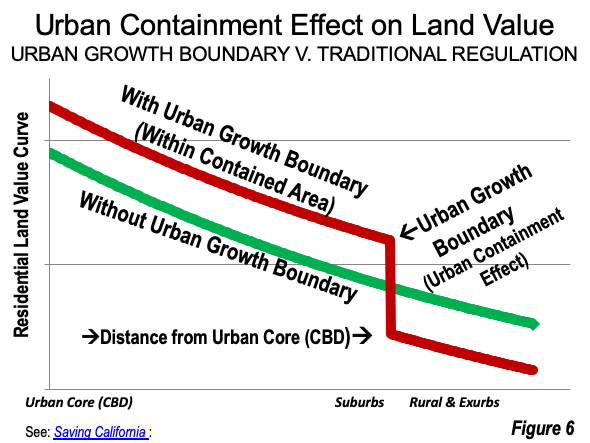
Under urban containment, land values spike upward at the urban fringe (such as at urban growth boundaries or green belts), and then spread throughout the enclosed urban area (Figure 6). This “urban containment effect “has been shown to multiply land costs from eight to 20 times (see: Saving California, Chapter 2: “California’s Housing Crisis”). This should not be surprising, since one of urban containment’s purposes is densification. (See: Restrictive Land-Use Regulation: Strategies, Effects and Solutions).
As demand continues to rise ahead of supply the urban containment effect seems likely to expand even more. All of this makes markets attractive to investors (speculators), looking for windfall profits (far greater than generally available in other investments).
Unaffordable Housing and Unaffordable Rents Go Hand in Hand
Further, this is not just about owned housing. There is a strong association between median house values and median gross rents among the 53 urban areas. There is a 0.942 correlation and a coefficient of determination of 0.887, indicating that an 89% increase rents is associated with a 100% increase in house values. Again, this is a robust relationship — statistically significant at the 99% confidence level. Where houses cost more, rents tend to be higher.
Density, Market Structure and Housing Affordability
The widely circulated view that densification improves housing affordability is far from proven. Indeed, the actual data shows that where urban densities are higher, housing affordability is worse. And where densification includes urban containment, housing affordability can be even worse.
Note 1: The ACS urban area estimates uses the 2010 urban area boundaries (defined by criteria, not by administrative jurisdictions), and 2019 population, which is the latest data. Urban land areas will be updated in not yet available 2020 census reports. back to reference
Note 2: I can identify with Professor Condon’s evolving analysis based on the evidence, having made a similar transition myself. Early in my career I was convinced that traffic congestion and economic performance in the Los Angeles area required development of a rail rapid transit system. Having been appointed to the Los Angeles County Transportation Commission by Mayor Tom Bradley, I offered, on the spur of the moment in a special meeting, the amendment to Proposition A that dedicated 35% of the authorized tax funding to rail development (which was adopted). By a decade later, the failed patronage promises and titanic cost overruns on such projects convinced me that urban rail projects were generally incapable of fulfilling the claims of their proponents (see: Present at the Creation).The Los Angeles rail system results are described in these articles (A Critical Review of Los Angeles Metro’s 28 by 2028 Plan by Thomas A. Rubin and James E. Moore II and my Connecting the Dots by Transit in Los Angeles) back to reference
Wendell Cox is principal of Demographia, an international public policy firm located in the St. Louis metropolitan area. He is a founding senior fellow at the Urban Reform Institute, Houston, a Senior Fellow with the Frontier Centre for Public Policy in Winnipeg and a member of the Advisory Board of the Center for Demographics and Policy at Chapman University in Orange, California. He has served as a visiting professor at the Conservatoire National des Arts et Metiers in Paris. His principal interests are economics, poverty alleviation, demographics, urban policy and transport. He is co-author of the annual Demographia International Housing Affordability Survey and author of Demographia World Urban Areas.
Mayor Tom Bradley appointed him to three terms on the Los Angeles County Transportation Commission (1977-1985) and Speaker of the House Newt Gingrich appointed him to the Amtrak Reform Council, to complete the unexpired term of New Jersey Governor Christine Todd Whitman (1999-2002). He is author of War on the Dream: How Anti-Sprawl Policy Threatens the Quality of Life and Toward More Prosperous Cities: A Framing Essay on Urban Areas, Transport, Planning and the Dimensions of Sustainability.
Photo: Density in Austin, Texas by Sk5893 via Flickr under CC 4.0 License.


