According to the results of the 2010 census, Shanghai's population was nearly 1,000,000 people more than had been projected by local authorities. The provincial level of jurisdiction grew from a population of 16.4 million in 2000 to 23.0 million in 2010. Shanghai is one of the world's fastest growing megacities (urban regions of more than 10 million population). Shanghai's 6.6 million population growth equals the strong growth of the Manila urban region over the same period but trails the 7.4 million growth in the Jakarta urban region. Shanghai modestly extended its lead over Beijing as China's largest urban region, where the growth over the same period was 5.8 million.
As is typical of urban regions around the world, Shanghai's population gain was concentrated outside the core, in suburban and exurban areas (see table at bottom). A map of Shanghai's districts can be seen here.
Suburban Growth: The nine suburban districts grew 69% between 2000 and 2010. The suburban areas grew from 9.5 million in 2000 to 16.0 million in 2010, adding the equivalent of the population of greater Toronto, Dallas-Fort Worth or the Rhine-Ruhr (Essen-Dusseldorf). The suburbs dominated growth, with 99.2% of the population gain
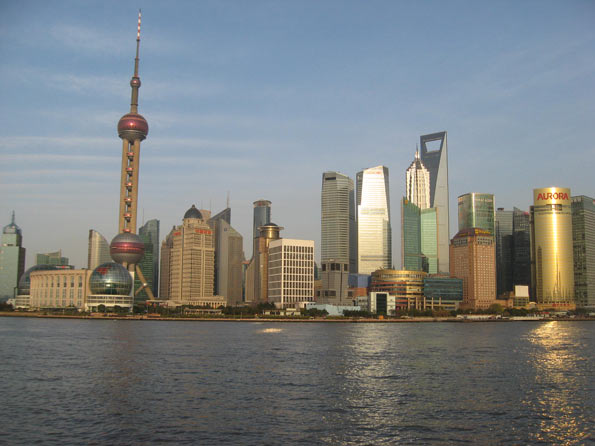
Sonjiang, to the west of Honquiao airport grew the most, adding nearly 150% to its population. Pudong, a huge district that extends from the new edge city development across the Huangpu River from downtown all the way to Pudong Airport on the Yangtze River added 1.9 million people and now has a population exceeding 5 million (Note).

Pudong Business District
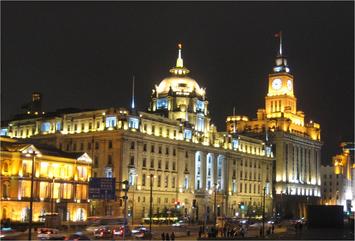
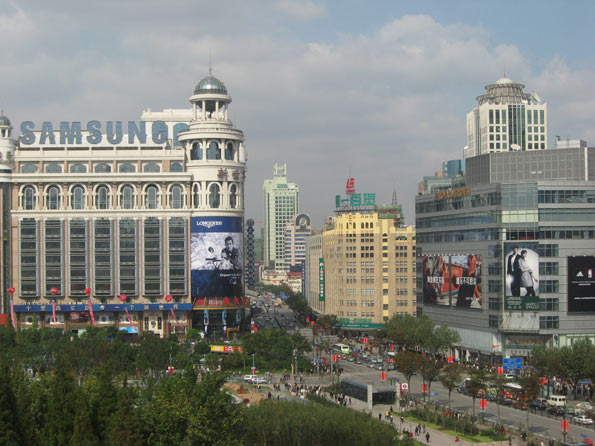
The Inner Core: The inner core is the all of the famous Bund, with its Western-style commercial architecture along the Huangpu River and Shanghai's best known shopping street, Nanjing road. The three districts of the inner core all lost population. Overall, the inner core population dropped from 1.209 million to 926,000, a decline of 23%. This may seem surprising, in view of the large number of high-rise condominium buildings that have been constructed in this area. However, these buildings typically replaced higher density low rise development that was generally not up to modern standards. The inner core has a population density of 119,400 people per square mile (46,100 per square kilometer), down from 155,700 per square mile (60,100 per square kilometer) in 2000. Even so, the inner core retains a population density more than 50% above that of either Manhattan or the ville de Paris.

Toward Nanjing Road
The Outer Core: The six districts of the outer core gained 6%, increasing from 5.723 million to 6.060 million people. Two districts sustained minor losses and another three made modest gains. The district of Putuo was the exception, gaining 23%. The outer core districts had a population density of approximately 60,100 per square mile, or 23,200 per square kilometer in 2010.
Overall, the entire core grew 0.8% and accounted for 0.8% of the growth in the jurisdiction. The population density was approximately 64,000 per square mile or 25,000 per square kilometer.
Urban and Rural Shanghai: Overall, Shanghai covers approximately 2,445 square miles (6,333 square kilometers), a land area somewhat more than that of the Statistics Canada defined Toronto metropolitan area (2,279 square miles or 5,901square kilometers). However, Shanghai's population is nearly four times that of the Toronto area. Even so, Shanghai's rural population remains at approximately 3,000,000 people.
Based upon the new census count, it is estimated that the population of the urban area is approximately 20,000,000. The suburban areas, inside the urban area but outside the core are estimated to have a population density of 10,600 per square mile or 4,100 per square kilometer, well below the density of the core. Even so, this suburban density is well above that of all but a few of the urban areas of Western Europe. The suburban areas include a number of undeveloped areas that are completely surrounded by urbanization.
Decentralized Employment: Shanghai has also developed a decentralized employment base, despite having one of the world's largest central business districts, with 1.25 million jobs. By comparison, Manhattan has approximately 1,750,000 jobs south of 59th Street, while Tokyo has approximately 4,000,000 jobs inside the Yamanote Loop. The central business district has approximately 15% of Shanghai's employment.
Shanghai's Urban Expansion: Shanghai continues to expand in virtually every direction. It is likely that Shanghai's urbanization will mean that of Kunshan, an urban area of nearly 1.5 million people located in the Suzhou Prefecture of Jiangsu. In addition, the urbanization is also likely to soon meet that of Taicang, another urban area in Suzhou that has a population of approximately 500,000. At least one of Shanghai's Metro lines is planned to be extended to Taicang.
Shanghai's urbanization is also poised to spill across the border into the province of Zhejiang. Development is also spreading to the east and southeast in Pudong, including Lingang, which will eventually have 1 million residents. The ocean will prevent further expansion in this direction. Lingang is the point from which a 17 mile (28 kilometer) long bridge crosses one-half of Hangzhou Bay Bridge to Shanghai's new island port, the largest in the world.
Shanghai exhibits the same trends that are evident in other world megacities. Like Seoul and Mexico City, the inner core population density is falling. And like Jakarta, Mumbai, Manila and most other large urban areas in the world, the overall population density is declining even as population growth continues.
| Shanghai: Population by District & County (Qu & Xian) | ||||||
| 2010 Census | ||||||
| POPULATION | ||||||
| Sector | Area: Square Kilometers | Population: 2000 | Population: 2010 | Population: Change 2000-2010 | % Change | % of Growth |
| INNER CORE | 20.1 | 1,209,000 | 926,000 | (283,000) | -23.4% | -4.3% |
| Huangpu Qu | 4.5 | 575,000 | 430,000 | (145,000) | -25.2% | -2.2% |
| Jing'an Qu | 7.6 | 305,000 | 247,000 | (58,000) | -19.0% | -0.9% |
| Luwan Qu | 8.0 | 329,000 | 249,000 | (80,000) | -24.3% | -1.2% |
| OUTER CORE | 261.4 | 5,723,000 | 6,060,000 | 337,000 | 5.9% | 5.1% |
| Changning Qu | 38.3 | 702,000 | 691,000 | (11,000) | -1.6% | -0.2% |
| Hongkou Qu | 23.5 | 861,000 | 852,000 | (9,000) | -1.0% | -0.1% |
| Putuo Qu | 54.8 | 1,052,000 | 1,289,000 | 237,000 | 22.5% | 3.6% |
| Xuhui Qu | 54.8 | 1,065,000 | 1,085,000 | 20,000 | 1.9% | 0.3% |
| Yangpu Qu | 60.7 | 1,244,000 | 1,313,000 | 69,000 | 5.5% | 1.0% |
| Zhabei Qu | 29.3 | 799,000 | 830,000 | 31,000 | 3.9% | 0.5% |
| CORE DISTRICTS | 281.5 | 6,932,000 | 6,986,000 | 54,000 | 0.8% | 0.8% |
| SUBURBAN | 6,051.1 | 9,476,000 | 16,031,000 | 6,555,000 | 69.2% | 99.2% |
| Baoshan Qu | 415.3 | 1,228,000 | 1,905,000 | 677,000 | 55.1% | 10.2% |
| Chongming Xian | 1,041.2 | 650,000 | 704,000 | 54,000 | 8.3% | 0.8% |
| Fengxian Qu | 687.4 | 624,000 | 1,083,000 | 459,000 | 73.6% | 6.9% |
| Jiading Qu | 458.8 | 753,000 | 1,471,000 | 718,000 | 95.4% | 10.9% |
| Jinshan Qu | 586.1 | 580,000 | 732,000 | 152,000 | 26.2% | 2.3% |
| Minhang Qu | 371.7 | 1,217,000 | 2,429,000 | 1,212,000 | 99.6% | 18.3% |
| Pudong Xin Qu | 1,210.4 | 3,187,000 | 5,044,000 | 1,857,000 | 58.3% | 28.1% |
| Qingpu Qu | 675.5 | 596,000 | 1,081,000 | 485,000 | 81.4% | 7.3% |
| Songjiang Qu | 604.7 | 641,000 | 1,582,000 | 941,000 | 146.8% | 14.2% |
| TOTAL | 6,332.6 | 16,408,000 | 23,019,000 | 6,611,000 | 40.3% | 100.0% |
| POPULATION DENSITY | ||||||
| Sector | Area: Square Kilometers | Area: Square Miles | Population/ KM2: 2000 | Population/ KM2: 2010 | Population/ Mile2: 2000 | Population/ Mile2: 2010 |
| INNER CORE | 20.1 | 7.8 | 60,100 | 46,100 | 155,700 | 119,400 |
| Huangpu Qu | 4.5 | 1.7 | 127,800 | 95,600 | 331,000 | 247,600 |
| Jing'an Qu | 7.6 | 2.9 | 40,100 | 32,500 | 103,900 | 84,200 |
| Luwan Qu | 8.0 | 3.1 | 41,100 | 31,100 | 106,400 | 80,500 |
| OUTER CORE | 261.4 | 100.9 | 21,900 | 23,200 | 56,700 | 60,100 |
| Changning Qu | 38.3 | 14.8 | 18,300 | 18,000 | 47,400 | 46,600 |
| Hongkou Qu | 23.5 | 9.1 | 36,600 | 36,300 | 94,800 | 94,000 |
| Putuo Qu | 54.8 | 21.2 | 19,200 | 23,500 | 49,700 | 60,900 |
| Xuhui Qu | 54.8 | 21.2 | 19,400 | 19,800 | 50,200 | 51,300 |
| Yangpu Qu | 60.7 | 23.4 | 20,500 | 21,600 | 53,100 | 55,900 |
| Zhabei Qu | 29.3 | 11.3 | 27,300 | 28,300 | 70,700 | 73,300 |
| CORE DISTRICTS | 281.5 | 108.7 | 24,600 | 24,800 | 63,700 | 64,200 |
| SUBURBAN | 6,051.1 | 2,336.3 | 1,600 | 2,600 | 4,100 | 6,700 |
| Baoshan Qu | 415.3 | 160.3 | 3,000 | 4,600 | 7,800 | 11,900 |
| Chongming Xian | 1,041.2 | 402.0 | 600 | 700 | 1,600 | 1,800 |
| Fengxian Qu | 687.4 | 265.4 | 900 | 1,600 | 2,300 | 4,100 |
| Jiading Qu | 458.8 | 177.1 | 1,600 | 3,200 | 4,100 | 8,300 |
| Jinshan Qu | 586.1 | 226.3 | 1,000 | 1,200 | 2,600 | 3,100 |
| Minhang Qu | 371.7 | 143.5 | 3,300 | 6,500 | 8,500 | 16,800 |
| Pudong Xin Qu | 1,210.4 | 467.3 | 2,600 | 4,200 | 6,700 | 10,900 |
| Qingpu Qu | 675.5 | 260.8 | 900 | 1,600 | 2,300 | 4,100 |
| Songjiang Qu | 604.7 | 233.5 | 1,100 | 2,600 | 2,800 | 6,700 |
| TOTAL | 6,332.6 | 2,445.0 | 2,600 | 3,600 | 6,700 | 9,300 |
----
Lead Photograph: The Bund (all photos by author)
Note: Pudong includes the large Pudong business district, which is directly across the Huangpu River from the Bund in the central business district. However, Pudong is a relatively new development and was not a part of the urban core. Moreover, Pudong extends far to the east and southeast.
Wendell Cox is a Visiting Professor, Conservatoire National des Arts et Metiers, Paris and the author of “War on the Dream: How Anti-Sprawl Policy Threatens the Quality of Life”


