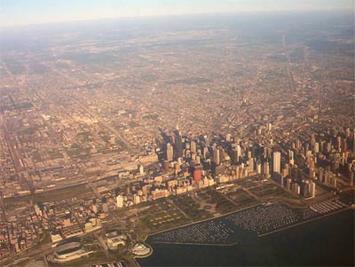
Looks can be deceiving. No downtown area in the western world outside Manhattan is more visually impressive than Chicago. Both the historic Loop and the newer development north of the Chicago River, especially along North Michigan Avenue have some of the most iconic structures outside of emerging Asia. Yet these vertical monuments mask a less celebrated reality: that of dispersing, low density urban area.
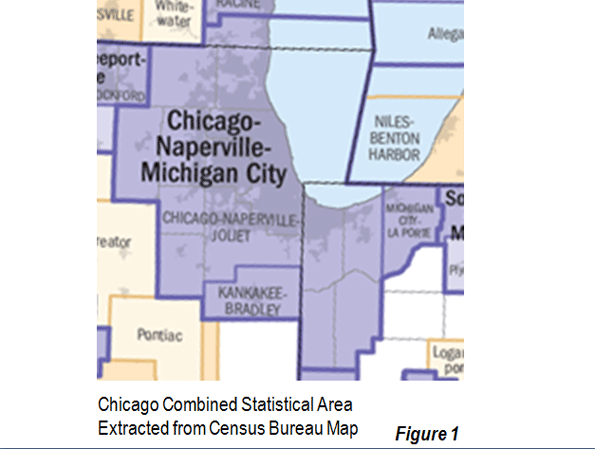
Chicago Combined Statistical Area: Let’s take a close look at the 2010 census data. Overall, the combined statistical area, which includes the metropolitan area (Note 1) and two exurban counties added nearly 365,000 people, for a growth rate of 3.9 percent. This is well below the national growth rate of approximately 10 percent (Map, Figure 1). Chicago followed the general trend of with growth being greatest in the outer suburbs while declines took place both in the inner suburbs and the historical core municipality (Figure 2).
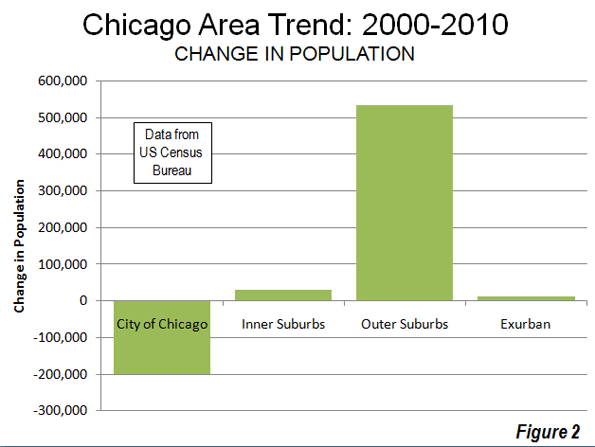
Massive Core City Loss: The historical core city of Chicago lost but 200,000 people, and fell to a population of 2.7 million, the lowest count since the 1910 census. The population is down 925,000 from 1950 and at the current rate would drop at least 1 million from the 1950 peak by the 2020 census. Chicago is at risk of joining London and Detroit as the only two historical core municipalities in modern times that have lost more than 1 million people.
Inner Suburbs: As in New York and Seattle, Chicago’s inner suburbs grew slowly. The inner suburbs include the part of Cook County that is outside the city of Chicago as well as Lake County, Indiana (home of Gary), which shares the city of Chicago's eastern border. The inner suburbs added fewer than 30,000 residents and grew only one percent.
This suggests some limitations to the newly developing mantra that has inner suburbs will be the locus of future growth although there are scattered inner suburbs in other cities (such as Hoboken, New Jersey) that did see growth. Perhaps the old mantra, about people returning to the city from which they had never come was finally quashed by the realities of the 2010 census.
Outer Suburbs: The outer suburbs, which include the remaining counties of the metropolitan area, grew at a rate of 16.5 percent, actually grew faster than the national average of approximately 10 percent. The outer suburbs added more than 500,000 people. The largest growth, 175,000 was in Will County, to the south, one of the five “collar counties” that used to define the boundaries of the metropolitan area. McHenry County, the most distant of the collar counties added 100,000. The fastest growth was in far suburban and also southern Kendall County, which more than doubled in population.
Chicago Metropolitan Area: Overall, the Chicago metropolitan area added approximately 360,000 people and grew 4.0 percent from 2000. This is well below the national average population growth rate, however was above that of the Los Angeles metropolitan area, once among the nation’s of leading growth areas until the last decade.
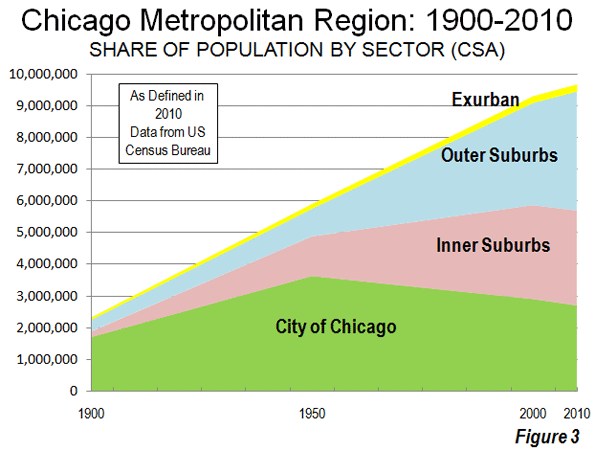
Historical Trends: The city of Chicago, like other historical core cities, had previously been dominant in its metropolitan area. The earliest Census Bureau metropolitan area (“metropolitan district”) estimates from 1900 indicated that more than 90 percent of the region’s population was contained in the city of Chicago. By 1950, the city of Chicago had fallen to 66 percent of the metropolitan area as defined in that year. The city of Chicago now has only 28 percent of the combined statistical area population of 9.7 million (Figure 3, Table and Note 2).
| CHICAGO METROPOLITAN AREA | ||||||
| POPULATION TREND BY COUNTY: 2000 TO 2010 | ||||||
| 1900 | 1950 | 2000 | 2010 | Change: 2000-2010 | % Change: 2000-2010 | |
| HISTORIC CORE MUNICIPALITY | ||||||
| Chicago | 1,698,575 | 3,620,962 | 2,895,671 | 2,695,598 | -200,073 | -6.9% |
| INNER SUBURBAN | 178,052 | 1,255,982 | 2,965,634 | 2,995,082 | 29,448 | 1.0% |
| Cook County, IL | 140,160 | 887,830 | 2,481,070 | 2,499,077 | 18,007 | 0.7% |
| Lake County, IN | 37,892 | 368,152 | 484,564 | 496,005 | 11,441 | 2.4% |
| OUTER SUBURBAN | 378,896 | 884,980 | 3,237,011 | 3,770,425 | 533,414 | 16.5% |
| DeKalb County, IL | 31,756 | 40,781 | 88,969 | 105,160 | 16,191 | 18.2% |
| DuPage County, IL | 28,196 | 154,999 | 904,161 | 916,924 | 12,763 | 1.4% |
| Grundy County, IL | 24,136 | 19,217 | 37,535 | 50,063 | 12,528 | 33.4% |
| Jasper County, IN | 14,292 | 17,031 | 30,043 | 33,478 | 3,435 | 11.4% |
| Kane County, IL | 78,792 | 150,388 | 404,119 | 515,269 | 111,150 | 27.5% |
| Kendall County, IL | 11,467 | 12,155 | 54,544 | 114,736 | 60,192 | 110.4% |
| Kenosha County, WI | 21,707 | 75,238 | 149,577 | 166,426 | 16,849 | 11.3% |
| Lake County, IL | 34,504 | 179,097 | 644,356 | 703,462 | 59,106 | 9.2% |
| McHenry County, IL | 29,659 | 50,656 | 260,077 | 308,760 | 48,683 | 18.7% |
| Newton County, IN | 10,448 | 11,006 | 14,566 | 14,244 | -322 | -2.2% |
| Porter County, IN | 19,175 | 40,076 | 146,798 | 164,343 | 17,545 | 12.0% |
| Will County, IL | 74,764 | 134,336 | 502,266 | 677,560 | 175,294 | 34.9% |
| CHICAGO METROPOLITAN AREA | 2,255,523 | 5,761,924 | 9,098,316 | 9,461,105 | 362,789 | 4.0% |
| EXURBAN METROPOLITAN COUNTIES | 75,540 | 150,332 | 213,939 | 224,916 | 10,977 | 5.1% |
| Kankakee Coiunty, IL | 37,154 | 73,524 | 103,833 | 113,449 | 9,616 | 9.3% |
| La Porte County, IN | 38,386 | 76,808 | 110,106 | 111,467 | 1,361 | 1.2% |
| CHICAGO COMBINED STATISTICAL AREA | 2,331,063 | 5,912,256 | 9,312,255 | 9,686,021 | 364,150 | 3.9% |
| Data from the US Census Bureau | ||||||
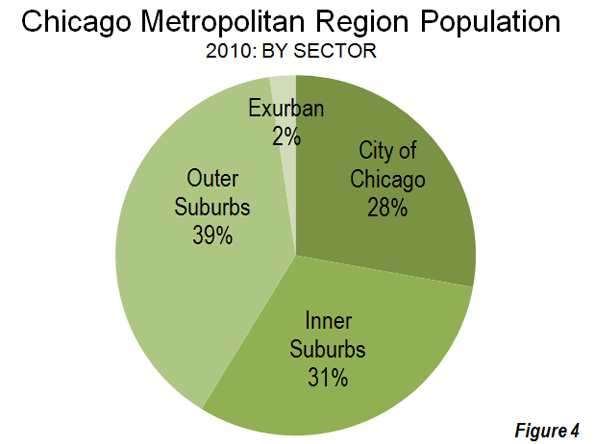
Since 1950 (Note 3), all of the growth in the Chicago area has been in the suburbs. By 2000, both inner suburbs and the outer suburbs each had more people than the city of Chicago. Today the outer suburbs, with forty percent of the region’s population, represent the largest demographic force in Chicago (Figure 4).
We do not usually associate Chicago with the dreaded term “sprawl” but Chicago now stands as the third largest urban agglomeration in the world in land area, trailing only New York and Tokyo. The Chicago urban area covers more land than Los Angeles, which has a far higher urban density.
Dispersing Employment: Chicago's dispersion extends to employment. Despite having the second strongest central business district in the nation (after Manhattan), jobs are rapidly decentralizing. Last year the Downtown Loop Alliance reported that private sector employment in the Loop fell 20 percent during the last decade. Overall, the downtown area of Chicago now represents approximately 10 percent of regional employment, barely half the percentage of Manhattan or Washington, DC.
American community survey data from 2009 indicates the total employment in the North West corridor along Interstate 90 has at least as much employment as downtown Chicago. This corridor, anchored by the edge city (Note 4) of Schaumburg, is typical of emerging suburban centers around the nation. Only two percent of workers in this corridor use transit for commuting.
Another corridor, along Interstate 88 (anchored by Lisle and Aurora) has at least two thirds the employment of downtown, with only one percent commuting by transit. The North Shore corridor encompassing parts of northern Cook County and Lake County is of similar size to the Interstate 88 corridor and has a larger transit work trip market share of five percent.
Downtown, on the other hand, has the third largest transit work trip market share in the nation, following Manhattan and Brooklyn. In 2000, 55 percent of people working downtown (the larger downtown including the Loop, north of the River and adjacent areas to the west and south) commuted by transit. This illustrates the strength of transit for providing access to the largest, most dense downtown areas in contrast to dispersed suburban areas.
Perhaps more telling, the number of jobs and resident workers (the “jobs-housing” balance) in the city of Chicago are converging toward equality. According to American community survey data, there are 1.1 jobs in the city of Chicago for each working resident. This is substantially less, for example, than Washington (2.6), Atlanta (2.0), Boston (1.7), San Francisco (1.4) and Baltimore (1.4).
On the other hand, two of the three large suburban corridors have higher ratios of jobs to workers than the city of Chicago. The Interstate 88 corridor has 1.3 jobs per worker, while the North Shore has approximately 1.5 jobs per worker. The Interstate 90 corridor has slightly more jobs than workers. These data indicate that Chicago is well on the way to a more evenly distributed employment pattern that has become more common around the nation.
Middle America’s Leviathan: The Chicago area has been very resilient through the years. After nearly a century as the nation’s “second city,” Aaron Renn points out the area could fall from its much cherished “global city” status. Still, Chicago remains the dominant urban area between the coasts. Virtually all of its Midwestern competition has fallen away (such as Detroit, St. Louis and Cleveland). However, in the longer run Chicago could be displaced by Dallas-Fort Worth and Houston. Nonetheless, the urban area’s visually arresting business district will retain its iconic status even if, overall, the region looks more and more like the rest of highly dispersed Middle America.
------
Note 1: This article uses metropolitan area and combined statistical areas as defined by the authoritative US Office of Management and the Budget.
Note 2: The 1950 references provided because the closest to the Post-War democratization of homeownership and car ownership and expansion of car oriented suburbanization. Before World War II, most US historical core cities were comparatively dense, while a far smaller share of the population lived in the suburbs.
Note 3: Figure 3 and the Table show data for the 2010 geographical definition of the combined statistical area. Earlier metropolitan area definitions are also referred to in the text.
Note 4: An “edge city” is a major employment center outside the central business district (downtown). “Edge city” became a part of the language as a result of Joel Garreau’s 1991 book, Edge City: Life on the Urban Frontier.
Photograph: Downtown Chicago from the Air (by author)


