
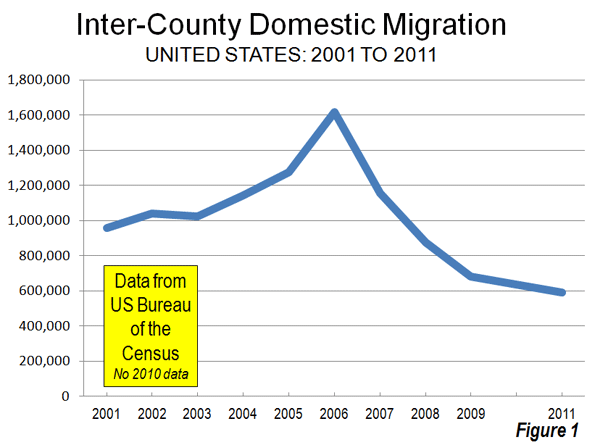
The new 2011 Census Bureau county and metropolitan area population estimates indicate that Americans are staying put. Over the past year, 590,000 people moved between the nation's counties. This domestic migration (people moving within the nation) compares to an annual rate of 1,080,000 between the 2000 and 2009. Inter-county domestic migration peaked in 2006 at nearly 1,620,000 and has been falling since that time (Figure 1). The continuing low rate of domestic migration has been reinforced by the economic malaise that has kept job and income growth well below levels that would be expected in a more genuine recovery.
Yet the nation has continued to grow. With less domestic migration, natural growth (births minus deaths) and considerable, but slower international migration, growth over the past year has been more in proportion to total population. The movement between counties within major metropolitan areas has become less of a factor. Predictably, there the usual doom and gloom reports about suburbs and exurbs and how poorly they are doing compared to before, and how people are returning to the cities (Note 1). As usual, the data shows no such thing, as people continue to move from core counties in greater numbers than others move in (See Note 2 on county classifications).
Domestic Migration: Despite the higher gasoline prices and the illusions of a press that is often anti-suburban, both the suburbs and the exurbs continued to attract people from elsewhere in the nation. The core counties, which contain the core cities, continued to lose domestic migrants to other parts of the country, principally to the suburbs and the exurbs of the large metropolitan areas.
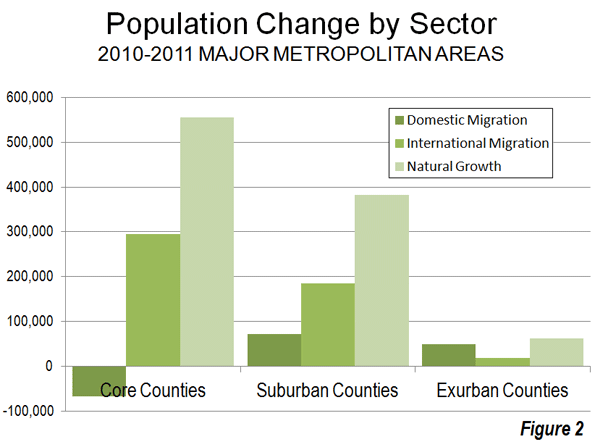
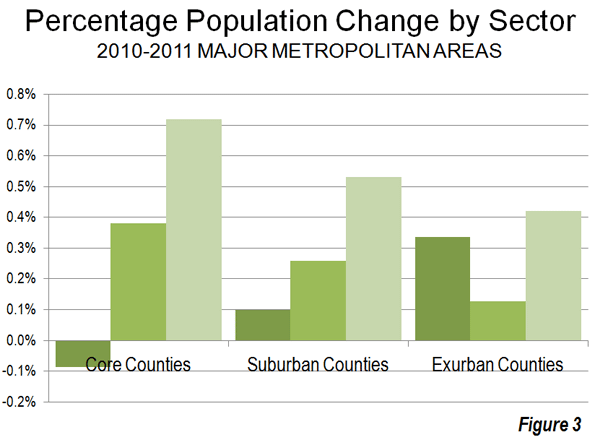
Over the past year, the core counties of major metropolitan areas lost 67,000 domestic migrants (people move between a metropolitan area and somewhere else in the nation). Suburban counties gained approximately 72,000 domestic migrants, while exurban counties gained 49,000 domestic migrants (Figure 2). Because of their lower population base, exurban counties had the highest relative rate of net domestic migration, at 0.34% of their 2010 population. This is more than three times the rate of the suburban counties (0.11%) and far higher than the minus 0.09% of the core counties (Figure 3). Thus, the overall slower rate of growth among exurban counties was due to a lower natural growth rate and less international migration, not the result of any losses to the core. The same is true, to a lesser extent, of the suburban counties.
Overall, the major metropolitan areas gained 48,500 domestic migrants between 2010 and 2011. By contrast, between 2000 and 2009, the major metropolitan areas lost, on average, nearly 200,000 domestic migrants to the rest of the nation each year. The huge domestic out migration in the last decade has been associated with the housing bubble. Less affordable housing markets lost 3.2 million domestic migrants between 2000 and 2009. More affordable markets gained 1.7 million domestic migrants. This was not enough to negate the losses in the higher cost markets, and major metropolitan markets lost 1.5 million domestic migrants overall.
Natural Growth: As the grim economic times induced people to stay put, core counties grew marginally faster than suburban and exurban counties principally because of higher natural growth rates, which is the net of births minus deaths. More than 70% of the higher population in core counties was from natural growth. Natural growth was less of a factor in the suburban counties, at 60%. In the exurban counties, natural growth accounted for only 47% of the population growth (Table 1). The higher core county natural growth rates are especially evident where there are large foreign born populations, due to their generally higher birth rates (such as Los Angeles, Dallas-Fort Worth, Houston, Austin and Riverside-San Bernardino, as well as Raleigh and Salt Lake City).
International Migration: The other component of growth was international migration, which contributed 38% of the growth in core counties and 29% of the growth in suburban counties. International migration was much less important in the exurban counties, contributing only 15% of the growth (Table 1)
| Table 1 | |||
| Major Metropolitan Areas | |||
| Components of Population Change: 2010-2011: Summary by Sector | |||
| Net Domestic Migration | Net International Migration | Natural Increase (Births Minus Deaths) | |
| Core Counties | -8.5% | 37.6% | 70.8% |
| Suburban Counties | 11.2% | 29.0% | 59.8% |
| Exurban Counties | 37.9% | 14.5% | 47.4% |
| Multi-County Major Metropolitan Areas | 3.5% | 32.1% | 64.3% |
| Single County Major Metropolitan Areas | -10.9% | 34.5% | 76.7% |
| Major Metropolitan Areas with More Than 1 County | 3.0% | 32.2% | 64.7% |
| Single County Major Metropolitan Areas: San Diego and Las Vegas | |||
The Gainers: The fastest growing major metropolitan areas were dominated by the four largest Texas metropolitan areas. Austin (3.2%), Dallas-Fort Worth (2.0%), Houston (1.9%) and San Antonio (1.9%) were all among the five fastest growing. Raleigh placed second, with a one-year growth rate of 2.3%. The top five numeric gainers in domestic migration were in all in Texas or Florida --- Dallas-Fort Worth (39,000), Miami (36,000), Austin (31,000), Tampa-St. Petersburg (27,000) and Houston (21,000). The much improved housing affordability in Florida seems likely to be a factor in the recovery of Miami and Tampa-St. Petersburg. Further, Houston became the second Texas metropolitan area to exceed Philadelphia in population, following Dallas-Fort Worth in the last decade. Texas thus becomes the first state to place two metropolitan areas in the five largest in the nation (Table 2).
| Table 2 | ||||
| Major Metropolitan Areas: Population | ||||
| Population: 2010-2011 | ||||
| Metropolitan Area | 2010 | 2011 | Change | % Change |
| New York, NY-NJ-PA | 18,919,649 | 19,015,900 | 96,251 | 0.51% |
| Los Angeles, CA | 12,844,371 | 12,944,801 | 100,430 | 0.78% |
| Chicago, IL-IN-WI | 9,472,584 | 9,504,753 | 32,169 | 0.34% |
| Dallas-Fort Worth, TX | 6,400,511 | 6,526,548 | 126,037 | 1.97% |
| Houston. TX | 5,976,470 | 6,086,538 | 110,068 | 1.84% |
| Philadelphia, PA-NJ-DE-MD | 5,971,589 | 5,992,414 | 20,825 | 0.35% |
| Washington, DC-VA-MD-WV | 5,609,150 | 5,703,948 | 94,798 | 1.69% |
| Miami, FL | 5,578,080 | 5,670,125 | 92,045 | 1.65% |
| Atlanta, GA | 5,286,296 | 5,359,205 | 72,909 | 1.38% |
| Boston, MA-NH | 4,559,372 | 4,591,112 | 31,740 | 0.70% |
| San Francisco-Oakland, CA | 4,343,381 | 4,391,037 | 47,656 | 1.10% |
| Riverside-San Bernardino, CA | 4,245,005 | 4,304,997 | 59,992 | 1.41% |
| Detroit. MI | 4,290,722 | 4,285,832 | (4,890) | -0.11% |
| Phoenix, AZ | 4,209,070 | 4,263,236 | 54,166 | 1.29% |
| Seattle, WA | 3,447,886 | 3,500,026 | 52,140 | 1.51% |
| Minneapolis-St. Paul, MN-WI | 3,285,913 | 3,318,486 | 32,573 | 0.99% |
| San Diego, CA | 3,105,115 | 3,140,069 | 34,954 | 1.13% |
| Tampa-St. Petersburg, FL | 2,788,151 | 2,824,724 | 36,573 | 1.31% |
| St. Louis, MO-IL | 2,814,722 | 2,817,355 | 2,633 | 0.09% |
| Baltimore, MD | 2,714,546 | 2,729,110 | 14,564 | 0.54% |
| Denver, CO | 2,554,569 | 2,599,504 | 44,935 | 1.76% |
| Pittsburgh, PA | 2,357,951 | 2,359,746 | 1,795 | 0.08% |
| Portland, OR-WA | 2,232,896 | 2,262,605 | 29,709 | 1.33% |
| San Antonio, TX | 2,153,891 | 2,194,927 | 41,036 | 1.91% |
| Sacramento, CA | 2,154,583 | 2,176,235 | 21,652 | 1.00% |
| Orlando, FL | 2,139,615 | 2,171,360 | 31,745 | 1.48% |
| Cincinnati, OH-KY-IN | 2,132,415 | 2,138,038 | 5,623 | 0.26% |
| Cleveland, OH | 2,075,540 | 2,068,283 | (7,257) | -0.35% |
| Kansas City, MO-KS | 2,039,766 | 2,052,676 | 12,910 | 0.63% |
| Las Vegas, NV | 1,953,927 | 1,969,975 | 16,048 | 0.82% |
| San Jose, CA | 1,841,787 | 1,865,450 | 23,663 | 1.28% |
| Columbus, OH | 1,840,584 | 1,858,464 | 17,880 | 0.97% |
| Charlotte, NC-SC | 1,763,969 | 1,795,472 | 31,503 | 1.79% |
| Austin, TX | 1,728,247 | 1,783,519 | 55,272 | 3.20% |
| Indianapolis, IN | 1,760,826 | 1,778,568 | 17,742 | 1.01% |
| Virginia Beach (Norfolk), VA-NC | 1,674,502 | 1,679,894 | 5,392 | 0.32% |
| Nashville, TN | 1,594,885 | 1,617,142 | 22,257 | 1.40% |
| Providence, RI-MA | 1,601,065 | 1,600,224 | (841) | -0.05% |
| Milwaukee, WI | 1,556,953 | 1,562,216 | 5,263 | 0.34% |
| Jacksonville, FL | 1,348,702 | 1,360,251 | 11,549 | 0.86% |
| Memphis, TN-MS-AR | 1,318,089 | 1,325,605 | 7,516 | 0.57% |
| Louisville, KY-IN | 1,285,891 | 1,294,849 | 8,958 | 0.70% |
| Oklahoma City, OK | 1,258,111 | 1,278,053 | 19,942 | 1.59% |
| Richmond, VA | 1,260,396 | 1,269,380 | 8,984 | 0.71% |
| Hartford, CT | 1,212,491 | 1,213,255 | 764 | 0.06% |
| New Orleans, LA | 1,173,572 | 1,191,089 | 17,517 | 1.49% |
| Raleigh, NC | 1,137,297 | 1,163,515 | 26,218 | 2.31% |
| Salt Lake City, UT | 1,128,269 | 1,145,905 | 17,636 | 1.56% |
| Buffalo, NY | 1,135,293 | 1,134,039 | (1,254) | -0.11% |
| Birmingham, AL | 1,129,068 | 1,132,264 | 3,196 | 0.28% |
| Rochester, NY | 1,054,723 | 1,055,278 | 555 | 0.05% |
| Total | 167,462,456 | 169,067,997 | 1,605,541 | 0.96% |
| Data derived from US Bureau of the Census | ||||
| Major Metropolitan Areas: Over 1,000,000 Population | ||||
The Losers: Four metropolitan areas, Detroit, Cleveland, Providence and Buffalo suffered small population losses. Pittsburgh had a small gain, but was alone in having an excess of deaths over births. New York again led the nation in its net domestic migration loss, at 99,000. Chicago lost 54,000 and Los Angeles lost 51,000 residents to other areas of the country between 2010 and 2011, while Detroit lost 24,000. Domestic migration data is available for New York City because it is composed of five counties. New York City lost 57,000 domestic migrants (Table 3).
| Table 3 | ||||
| Major Metropolitan Areas | ||||
| Components of Population Change: 2010-2011 | ||||
| Net Domestic Migration | Net International Migration | Natural Increase (Births Minus Deaths) | Total Components of Change (Note) | |
| New York, NY-NJ-PA | (98,975) | 83,322 | 112,336 | 96,683 |
| Los Angeles, CA | (50,549) | 54,725 | 96,150 | 100,326 |
| Chicago, IL-IN-WI | (53,908) | 24,422 | 61,483 | 31,997 |
| Dallas-Fort Worth, TX | 39,021 | 23,291 | 63,504 | 125,816 |
| Houston. TX | 21,580 | 24,105 | 64,363 | 110,048 |
| Philadelphia, PA-NJ-DE-MD | (13,133) | 11,413 | 22,769 | 21,049 |
| Washington, DC-VA-MD-WV | 21,517 | 24,872 | 48,235 | 94,624 |
| Miami, FL | 36,191 | 35,215 | 20,440 | 91,846 |
| Atlanta, GA | 12,419 | 17,370 | 42,908 | 72,697 |
| Boston, MA-NH | (1,627) | 15,494 | 18,143 | 32,010 |
| San Francisco-Oakland, CA | 5,880 | 17,996 | 23,939 | 47,815 |
| Riverside-San Bernardino, CA | 15,131 | 9,065 | 35,826 | 60,022 |
| Detroit. MI | (24,170) | 7,468 | 11,734 | (4,968) |
| Phoenix, AZ | 5,585 | 15,866 | 32,847 | 54,298 |
| Seattle, WA | 17,598 | 12,228 | 22,280 | 52,106 |
| Minneapolis-St. Paul, MN-WI | 536 | 7,832 | 24,296 | 32,664 |
| San Diego, CA | 816 | 9,591 | 24,703 | 35,110 |
| Tampa-St. Petersburg, FL | 27,157 | 6,857 | 2,318 | 36,332 |
| St. Louis, MO-IL | (10,260) | 2,671 | 10,256 | 2,667 |
| Baltimore, MD | (1,341) | 5,004 | 10,941 | 14,604 |
| Denver, CO | 19,565 | 5,204 | 19,997 | 44,766 |
| Pittsburgh, PA | 3,740 | 1,426 | (3,260) | 1,906 |
| Portland, OR-WA | 11,388 | 4,806 | 13,511 | 29,705 |
| San Antonio, TX | 19,515 | 3,841 | 17,486 | 40,842 |
| Sacramento, CA | 2,856 | 6,173 | 12,659 | 21,688 |
| Orlando, FL | 10,394 | 9,767 | 11,557 | 31,718 |
| Cincinnati, OH-KY-IN | (7,149) | 2,152 | 10,624 | 5,627 |
| Cleveland, OH | (12,521) | 1,896 | 3,344 | (7,281) |
| Kansas City, MO-KS | (2,820) | 3,009 | 12,705 | 12,894 |
| Las Vegas, NV | (6,353) | 8,007 | 14,395 | 16,049 |
| San Jose, CA | (2,704) | 11,072 | 15,376 | 23,744 |
| Columbus, OH | 2,219 | 3,329 | 12,390 | 17,938 |
| Charlotte, NC-SC | 13,778 | 4,581 | 13,038 | 31,397 |
| Austin, TX | 30,669 | 6,134 | 18,085 | 54,888 |
| Indianapolis, IN | 1,940 | 2,953 | 12,827 | 17,720 |
| Virginia Beach (Norfolk), VA-NC | (7,086) | 2,382 | 10,044 | 5,340 |
| Nashville, TN | 9,323 | 3,015 | 9,867 | 22,205 |
| Providence, RI-MA | (6,254) | 2,487 | 2,940 | (827) |
| Milwaukee, WI | (4,862) | 1,796 | 8,384 | 5,318 |
| Jacksonville, FL | 2,911 | 1,935 | 6,691 | 11,537 |
| Memphis, TN-MS-AR | (2,933) | 1,841 | 8,615 | 7,523 |
| Louisville, KY-IN | 1,886 | 1,711 | 5,400 | 8,997 |
| Oklahoma City, OK | 8,746 | 2,228 | 8,904 | 19,878 |
| Richmond, VA | 1,546 | 1,965 | 5,519 | 9,030 |
| Hartford, CT | (4,749) | 3,066 | 2,493 | 810 |
| New Orleans, LA | 10,153 | 1,563 | 5,630 | 17,346 |
| Raleigh, NC | 13,262 | 3,228 | 9,608 | 26,098 |
| Salt Lake City, UT | 915 | 3,090 | 13,674 | 17,679 |
| Buffalo, NY | (2,558) | 1,185 | 176 | (1,197) |
| Birmingham, AL | (2,452) | 1,245 | 4,421 | 3,214 |
| Rochester, NY | (3,320) | 1,235 | 2,650 | 565 |
| Total | 48,513 | 517,129 | 1,039,221 | 1,604,863 |
| 3.0% | 32.2% | 64.8% | 100.0% | |
| Data derived from US Bureau of the Census | ||||
| Major Metropolitan Areas: Over 1,000,000 Population | ||||
| Excludes San Diego and Las Vegas, which have only a single county | ||||
Captive v. Discretionary Markets? One year's data does not make a trend, especially in unusual times. Until the nation returns to normal economic growth, many young who would otherwise move are staying put, as well as young families that would be looking for larger houses. The driving factor in the more modest domestic migration trends observed today could well be necessity rather than desire.
Wendell Cox is a Visiting Professor, Conservatoire National des Arts et Metiers, Paris and the author of “War on the Dream: How Anti-Sprawl Policy Threatens the Quality of Life”
----
Note 1: It is a misconception that suburbs and exurbs have grown principally because people have moved from cities. In fact, most suburban and exurban growth has been from smaller towns and rural areas. See Cities and Suburbs: The Unexpected Truth. Components of change data (domestic migration, international migration and natural growth) is available only at the county level. Thus, city or municipality data is only available where a municipality and a county are combined.
Note 2: The core county contains all or most of the largest historical core municipality (see Suburbanized Core Cities) in the metropolitan area, except in New York, where all five counties that comprise the city of New York are classified as core counties. The suburban counties are those designated by the Bureau of the Census as central counties, but exclude the core counties. The exurban counties are as classified by the Bureau of the Census.
Note 3: The largest historical core municipalities comprise slightly more than 55 percent of the core county population (both figures combined).
Photo: Chicago (West Wacker Drive) By Author


