
This is by far the most difficult article I have ever had to write. I have been a fan of the US Bureau of the Census since I began following its numbers in the second grade. Much of my career has been spent analyzing these numbers and those of similar national statistical bureaus around the world. Yet, the 2011 sub-county estimates produced by the Census Bureau should never have been released, because they were not estimates, but they were rather "fair share" allocations of county population growth (or loss).
Analysts believing the numbers to be estimates have spent considerable ink in explaining the results. Some articles noted that core cities were adding population faster than suburban areas, such as an article based on Brookings Institution research in The Wall Street Journal. Others, such as me noted that there was evidence of faster core growth in some metropolitan areas, but that core county migration data (the lowest geographical level available) continued to overwhelmingly show net domestic migration to the suburbs.
In fact, however, it turns out that no-one knows that is happening to sub-county populations, in the historic cores or in the suburbs. Regrettably the results announced by the Census Bureau were virtually meaningless. This was revealed on newgeography.com by Chris Briem of the University of Pittsburgh just days after the release of the estimates. Briem reviewed the Census Bureau's sub-county population estimation methodology for 2010-2011 and found that county populations had largely been allocated to sub-county jurisdictions based upon their share of the 2010 population. The result is that all sub-county jurisdictions in each country grew (or lost population) by nearly the same percentage. Obviously, this cannot be.
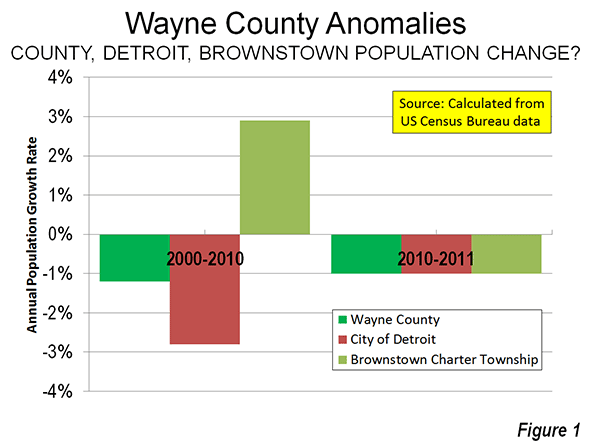
Brownstown Charter Township: Rising Population in Reversal?
This means, for example, that Brownstown Charter Township, a rare oasis of population growth (suburban or core city) in Wayne County, Michigan was apportioned virtually the same percentage population loss as occurred in the county. Like the city of Detroit, which since 1950 has managed to shed more people than live in all but two Canadian core cities, Brownstown is reported to have lost the same 1.0 percent that is reported to have occurred in the city and the county (Note). How different this is from the 2000s, when Brownstown grew an average of 2.9 percent annually, while Detroit lost 2.8 percent and Wayne County 1.3 percent annually (Figure 1). We hope Brownstown's citizenry was not alarmed by this sudden turnaround.
A One Year Change in Methodology
The problem results because of a single year change in the way the Census Bureau estimates population below the County level. As the Bureau indicates in its methodology notes:
"Our method of producing housing unit estimates is different this year than in years past. The Vintage 2011 housing unit estimates do not rely on the usual components of housing change (building permits, non-permitted builds, mobile home shipments, and housing loss), which we used last decade to produce the housing unit estimates. Instead, we created the Vintage 2011 estimates by extrapolating the average monthly change in housing units at the county level, then summing these estimates to create estimates for the states and nation. To produce subcounty housing unit estimates, we distributed the extrapolated county estimates down to each subcounty area within a county based on 2010 Census proportions."
The meaninglessness of the estimates is evident in examinations of two metropolitan areas where the core cities were reported to have grown faster than suburban areas, Miami and Orlando.
Miami Metropolitan Area
Figure 2 shows that in the Miami metropolitan area, the many cities and towns in the core Miami-Dade County grew at virtually the same population rate as the county overall. This means, for example, that the core city of Miami also grew at the same rate, according to the Census Bureau figures. The same thing can be seen in suburban Broward County, where all of the cities grew at virtually the same rate as the county as well as in Palm Beach County. From Figure 2, it can be seen that the estimates show the city of Miami could have grown faster than all the suburbs in Broward County and Palm Beach County, and at virtually the same rate as the suburbs and Miami-Dade County. No judgments can be made about relative population trends where estimates simply allocate the change base upon the base year distribution of population.
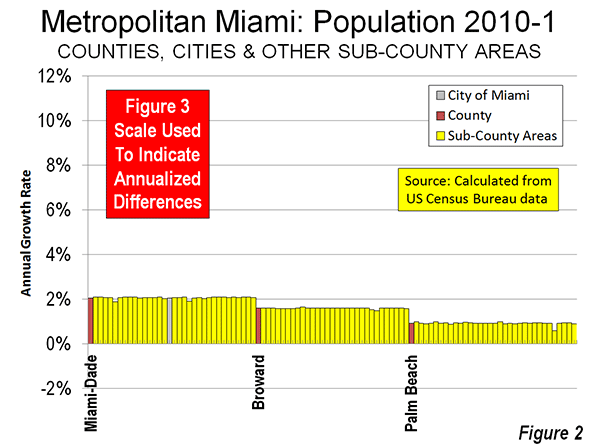
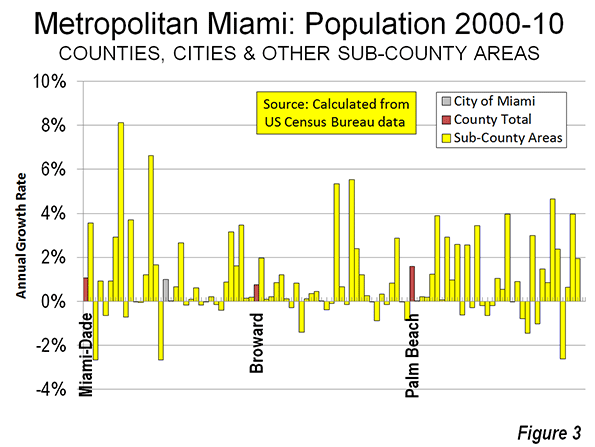
Figure 3 indicates the extent to which this methodology varies with the more comprehensive "components of housing change" methodology previously used by the Census Bureau (above). These annual population increase rates, between 2000 and 2010 are for the very same sub-county jurisdictions in Figure 2. This kind of variation in population growth rate would be expected in any year, rather than the flat-lined Census Bureau allocations
Orlando Metropolitan Area
Figure 4, covering the Orlando metropolitan area indicates the same situation. Each of the sub-county jurisdictions in the four metropolitan area counties is reported to have grown at approximately the same rate as its home county. Any conclusion that the city of Orlando grew faster than the suburbs, such as those in Lake and Seminole counties is invalid, since the city population growth is simply an allocation of the county growth.
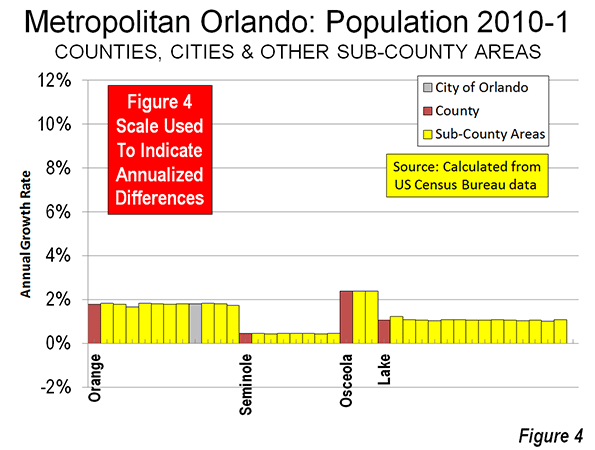
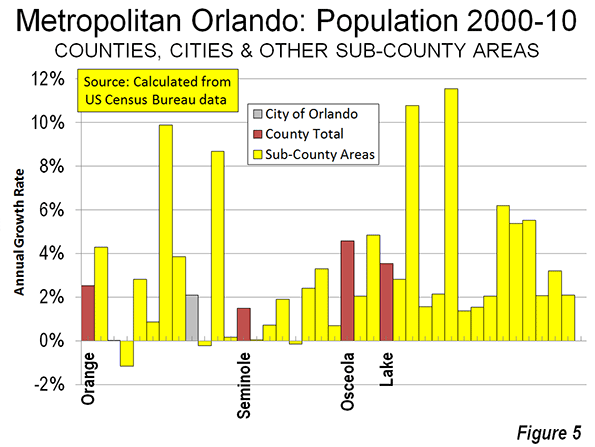
Figure 5 shows of the annualized growth rate for the sub-county jurisdictions of the Orlando metropolitan area of between 2000 and 2011. Again, there was a huge variation in growth between the sub-county jurisdictions. A dispersion of growth rates would have had the "fair share" population estimation mythology been employed for 2010 to 2011.
Justifying the One Year Change
The Census Bureau indicates that it changed its methodology for the current estimation year because “we are presently evaluating the 2010 housing estimates relative to the 2010 Census results, and considering improvements to the existing housing unit method for the new decade." Fair enough. Calling allocations estimates, however, is not.
Further, at least some at the Census Bureau perceive that these to be genuine estimates. The accompanying press release entitled "Texas Dominates List of Fastest-Growing Large Cities Since 2010 Census, Census Bureau Reports." Actually, the Census Bureau has no data on which cities grew the fastest between 2010 and 2011, nor does anyone else.
Unfortunate Timing
It is unfortunate that the Census Bureau determined to go forward with meaningless estimates at the very same time important statistical gathering programs such as the American Community Survey are under threat of defunding by the Congress.
Beware: Make No Comparisons
One of the purposes of sub-county population estimates is to provide information on the relative growth between jurisdictions. The estimates are also used in the Census Bureau's challenge process, which allows cities to seek revision of their population estimates, leading to a greater allocation of federal funding. We assume that no population challenges will be accepted based upon these allocations. Indeed, based on the latest Census of Government counts, more than 35,000 municipalities and minor civil divisions would seem to have standing for challenges.
Fortunately, there are plans to return to estimates rather than allocations for the 2012 round. The 2011 estimates should be withdrawn. Census Bureau should make it clear allocations did not represent genuine estimates of population change.
We have redacted part of our article analyzing the 2011 sub-county population estimates.
Postscript: Headline Illusions
The misleading issue of historical core cities drawing people from suburban areas was raised anew by a recent article headlined "We're In The Midst Of A Huge Migration From Suburbs To Cities" in The Business Insider. The article was attributed to Rolf Pendall, director of the Urban Institute Metropolitan Housing and Communities Policy Center, who said no such thing. Pendall's article in Atlantic Cities was more appropriately headlined "The Next Big Question Facing Cities: Will Millennials Stay?" A good question.
Wendell Cox is a Visiting Professor, Conservatoire National des Arts et Metiers, Paris and the author of “War on the Dream: How Anti-Sprawl Policy Threatens the Quality of Life.”
----
Note: There were minor variations in the second decimal digit of the growth rates because of the small group quarters portion (people in dormitories, prisons and other group housing) population change, for which the Census Bureau produced genuine estimates.


The problems are actually worse ...
The monthly estimates referred to by Mr. Cox aren't actually monthly estimates for 2011, but a rate of change calculated between housing unit estimates for 2009 (after a decade of estimates) and the actuality of the decennial census of 2010. That rate of change was extended out to 2011 -- in essence, not only are the numbers not apportioned correctly, but they aren't, well, new numbers.
Per the methodology:
"To estimate the number of housing units in each county, we first calculated housing unit change between July 1, 2009 and April 1, 2010, using the 2000-2010 Intercensal Estimates and the 2010 Census counts. ... We then extrapolated the average monthly housing unit change to create estimates for July 1, 2010 and July 1, 2011."
A Matter for Concern
Thank you for your additional research, which could indicate even more fundamental difficulties.
Wendell Cox
Demographia
www.demographia.com