
For some time, many in the urban planning community have been proclaiming a "sea-change" in household preferences away from suburban housing in the United States.
Perhaps no one is more identified with the "sea-change" thesis than Arthur C. Nelson, Presidential Professor, City & Metropolitan Planning, University of Utah. Professor Nelson has provided detailed modeled market estimates for California in a paper published by the Urban Land Institute, entitled The New California Dream: How Demographic and Economic Trends May Shape the Housing Market: A Land Use Scenario for 2020 and 2035 (He had made generally similar points in a Journal of the American Planning Association article in 2006).
Professor Nelson says that the supply of detached housing on what he defines as conventional sized lots (more than 1/8 acre) is far greater than the demand in California (Note 1). He further finds that the demand of detached housing on smaller lots is far greater than the supply. Professor Nelson's conclusions are principally modeled from stated preference surveys, which can mislead if people act differently when they make choices in the real world.
The Modeled Demand Estimates
Nelson models the demand for housing types in California's largest four planning regions (Southern California Association of Governments for the Los Angeles area, and the Bay Area Association of Governments for the San Francisco-San Jose area, the San Diego Association of Governments and the Sacramento Area Council of Governments). He estimates 2010 both supply and demand. His demand estimates rely strongly on data from three early 2000s stated preference surveys conducted by the Public Policy Institute of California (PPIC).
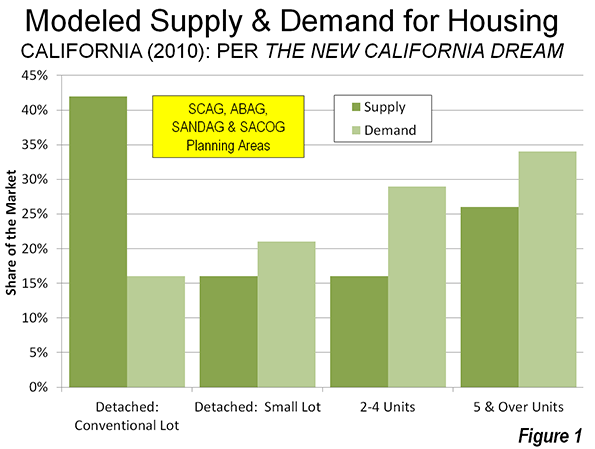
- Nelson's data indicates a strong preference for multi-family housing, which he places at 62% of demand in 2010, compared to the 2000 supply of 42%. Thus, the demand for multi-family housing is suggested to be one half above the supply.
- The most stunning conclusion, however, is an over-supply of detached housing on conventional lots that Nelson estimates. Compared to a 2000 supply of 42% of the market, Nelson estimates the demand to be only 16%. This would indicate the supply of such housing to be more than 2.5 times the demand as is indicated in Figure 1.
Nelson's findings on conventional lot detached housing have obtained the most attention. He surmises that virtually all of the demand over the next 25 years can be met by the existing stock of conventional lot detached housing. This is music to the ears of many urban planners, who have for decades demonized the suburbanization that has been preferred by the overwhelming majority of Californians (and Americans, and people elsewhere in the world where they can afford them).
Actual Demand: Revealed Preferences: 2000-2008
To perform a similar analysis, we used revealed preference data: the actual change in housing by type from the 2000 Census data to the latest American Community Survey (ACS) 2006-2010 data at the census tract level (Note 2).
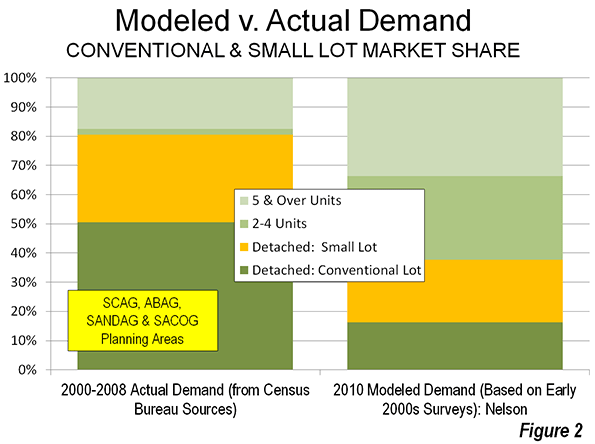
In contrast to Professor Nelson's estimates, the demand data indicates a strong continuing preference among Californians for detached housing on conventional lots. From 2000 to 2008 (the middle year for the 2006-2010 data), 51 percent of the new occupied housing in the four planning areas is estimated to have been detached on conventional lots (Figure 2). This is more than three times the 16% demand estimate in Professor Nelson's data. In fact, the actual demand was higher than the 2000 supply (42%), indicating that the demand for detached houses on conventional lots has increased.
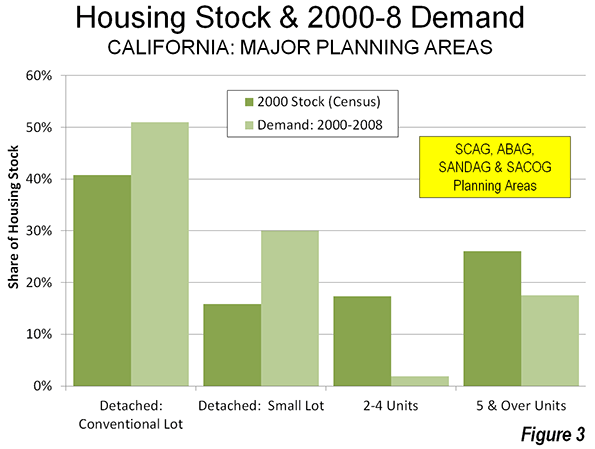
If there is a sea change, it would appear to be in multi-family housing. In contrast with the 62% share for multi-family dwellings modeled by Nelson, the actual demand indicated in the census tract data was two-thirds less, at 19% (Figure 3), well below the supply of 43 percent in 2000. This suggests a tanking of demand for multi-family housing, even as builders, in California and elsewhere, put more product on the market.
Why Accounts for the Difference
Various factors appear likely to contribute to the difference between the modeled demand and the actual demand.
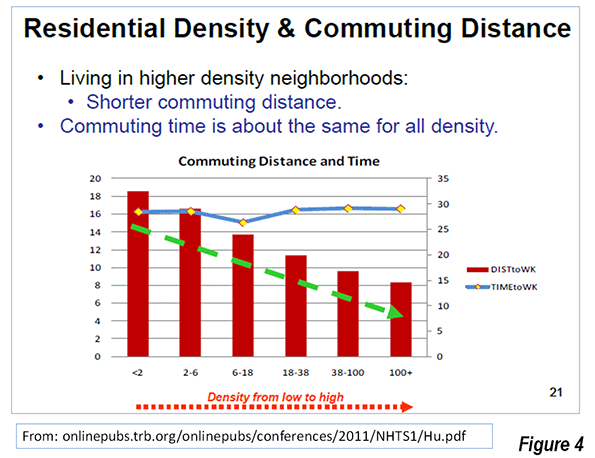
Smaller Lots and Higher Density Do Not Mean Shorter Commutes: The PPIC survey questions implied a connection between larger lots (lower density) and longer commutes. This is the broadly shared perception, but in reality houses on smaller lots (necessarily in higher density neighborhoods) do not mean shorter commutes. This is illustrated in a chart by Southern California Association of Governments (SCAG) researchers on page 62 of The New California Dream. In the original SCAG document, the authors note that "commuting time is about the same for all density" (Figure 4). This is not surprising, since higher densities are associated with more intense traffic congestion and with greater transit use, both of which lengthen commutes (Note 3).
The "higher density means shorter commute" myth is rooted in the obsolete mono-centric conception of the city. Almost all US urban areas have become poly-centric with job locations highly-dispersed, as jobs have followed people to the suburbs. Gordon and Lee (Note 4) have shown that work trip travel times in the United States are shorter to dispersed employment locations than to central business districts or secondary business centers (such as "Edge Cities").
Invalid Perceptions of Transit Mobility: Professor Nelson also stresses stated preference responses showing that many people would prefer to live near transit service. All things being equal, who wouldn't?
But all things are not equal. Living near transit does not mean practical transit access to most of the urban area. In most cases, only a car can provide that. Transit systems are necessarily focused on downtown areas (central business districts), which contain, on average, only 8% of employment in the four planning regions. , Travel to other destinations is usually inconvenient, because of time-consuming transfers, or not available at all.
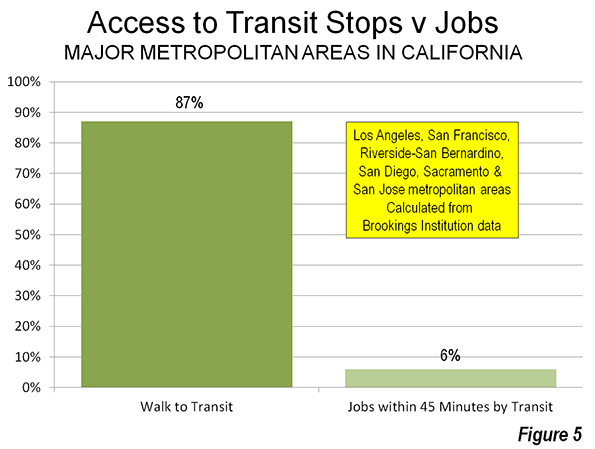
A Brookings Institution report indicated that 87 percent of people in California's major metropolitan areas (Los Angeles, San Francisco, Riverside-San Bernardino, San Diego and Sacramento) live within walking distance of transit. Yet, the average employee can reach only 6% of the jobs in their respective metropolitan area in 45 minutes (Figure 5). By contrast, the average work trip travel time ranges from 25 minutes to under 30 minutes in the four planning regions .
Households thinking about a move to higher density could have been, upon more serious examination, deterred by transit's severe mobility limitations.
Data Insufficiently Robust for the Modeling: There is also the potential that the PPIC surveys, with their general questions, were not of sufficient robustness to support Professor Nelson’s assertions. For example, PPIC did not define the size of small lots.
Planning and Reality
If households were so eager to move from detached houses on conventional lots to smaller lots, 2000 to 2008 would have been the ideal time. The mortgage industry was literally falling over itself to fund home purchases. Urban core wannabes could have flooded the market pursuing their smaller lot "stated preferences." The actual, revealed preference data says they did not, which is also indicated by the continuing strength of suburban growth relative to central city growth (Note 5).
Thus, the modeled demand estimates in The New California Dream appear to be at substantial odds with the actual demand.This is much more than an academic issue. The conclusions of The New California Dream have achieved the status of sacred text in the canon of urban planning and are mouthed unquestioningly by organizations like the Urban Land Institute.
Worse, demand estimates from The New California Dream are being relied upon in regional transportation plans being developed by California's metropolitan planning organizations (MPOs). This is particularly risky because these same MPOs have been granted greater power over housing under California's Senate Bill 375, goaded on by a sue-happy state Attorney General's office. The attempt by MPOs to impose their housing plans and regulations on consumers could well backfire, for investors in condominium and multifamily housing. This would not be a first time that developers followed urban planning illusions like lemmings over a cliff, to which huge losses in the last decade attest. The more destructive effects, however, are likely to be paid by households and the economies of California's metropolitan areas.
---------
Note 1: More than 70% of the detached housing stock was on conventional lots in 2000.
Note 2: There is no census tract data on detached house lot size. We scaled the detached housing data from the 2000 census to match Professor Nelson's distribution of detached housing supply by lot size, using population density. Nelson's method and ours were sufficiently similar that the results should have been roughly comparable. As the text indicates, they were not.
Note 3: In each of the three PPIC surveys, respondents are asked to choose between housing alternatives that are high in the questions to commute "lengths." From the description and survey instruments in the PPIC reports, there is no indication that respondents were given any idea what commute "length" means. There are two way to judge commute "length." One is distance or miles, while the other is time. Based upon the PPIC survey instrument, it cannot be known which definition was perceived by the respondents.
Even so, it seems more likely that the term "commute length" was perceived by respondents in time rather than in distance by respondents. Each day, people have only so many hours and minutes available. However, distance is not so constrained, depending upon the speed of the commute. Further, the extensive research on commuting often refers to "travel budgets," which are expressed in time, not distance.
Note 4: Reference: Gordon, P. and B. Lee (2012), "Spatial Structure and Travel: Trends in Commuting and Non-Commuting Travels in US Metropolitan Areas," draft chapter for the International Handbook on Transport and Development edited by Robin Hickman, David Bonilla, Moshe Givoni and David Banister.
Note 5: The most recent year (2010-2011), for which the Census Bureau had issued invalid municipal population estimates, indicated a continued the trend toward suburban rather than urban core growth, as has been shown by Trulia Chief Economist Jed Kolko (see: Even After the Housing Bust, Americans Still Love the Suburbs).
=======
Photograph: Suburban San Diego
Wendell Cox is a Visiting Professor, Conservatoire National des Arts et Metiers, Paris and the author of “War on the Dream: How Anti-Sprawl Policy Threatens the Quality of Life.”


Thanks for a wonderful
Thanks for a wonderful share. Your article has proved your hard work and experience you have got in this field. Brilliant .i love it reading.
cormar carpets
Great post I would like to
Great post I would like to thank you for the efforts you have made in writing this interesting and knowledgeable article.
NITROvit
This article gives the light
This article gives the light in which we can observe the reality. This is very nice one and gives indepth information. Thanks for this nice article.
um die Führungs
Thanks for posting this
Thanks for posting this info. I just want to let you know that I just check out your site and I find it very interesting and informative. I can't wait to read lots of your posts.
über uns
I just couldn't leave your
I just couldn't leave your website before telling you that I truly enjoyed the top quality info you present to your visitors? Will be back again frequently to check up on new posts.
https://www.rebelmouse.com/amandaletofibroidsmiracle/
useful information on topics
useful information on topics that plenty are interested on for this wonderful post.Admiring the time and effort you put into your b!..
www.audiovisie-goethals.be
It was wondering if I could
It was wondering if I could use this write-up on my other website, I will link it back to your website though.Great Thanks. uitbesteden payroll
I read that Post and got it
I read that Post and got it fine and informative. Please share more like that...
http://www.youtube.com/watch?v=WxJ7m2dwncQ
south-carolina-reverse-mortgage
A reverse mortgage in can south-carolina benefit seniors looking to stay in their home while taking advantage of equity in their home. Since south-carolina did not undergo a huge price inflation in their homes as in other states, most south-carolina seniors did not lose that much in home equity and may still have enough to qualify for a reverse mortgage.
http://www.reversemortgagelendersdirect.com/south-carolina-reverse-mortg...
Comment on comment...
The other poster's conjectural analysis is typical of the smart growth crowd, in the it loves to try to find "potential" or "preference" where non legitimately exists. The comment about how there might be hidden segments of the market that are just frothing to move into high density multi unit apts it is at best wishful thinking and is at worst the type of propagandist thinking that the accuse contemporary "sprawl promoters" of advancing. If anything, Cox's analysis point towards a huge problem that I have seen in complex academically based policy research. There is enough play in the joints to be able to advance ideologically based agendas that really do not reflect what most people would reasonably want. Oddly, enough this results int he creation of quasi religious policy doctrines that are assumed de facto to be valid. As the other commenter highlights people who "want to believe" will go to extreme if not non-nonsensical lengths to "prove" their way of thinking is valid despite more reasoned analyses leading to the conclusion that it is not.