The new state (and DC) population estimates indicate a substantial slowdown in growth, from an annual rate of 0.93 percent during the 2000s to 0.75% between 2011 and 2012. This 20 percent slowdown in growth was driven by a reduction in the crude birth rate to the lowest point ever recorded in the United States (12.6 live births per 1000 population).
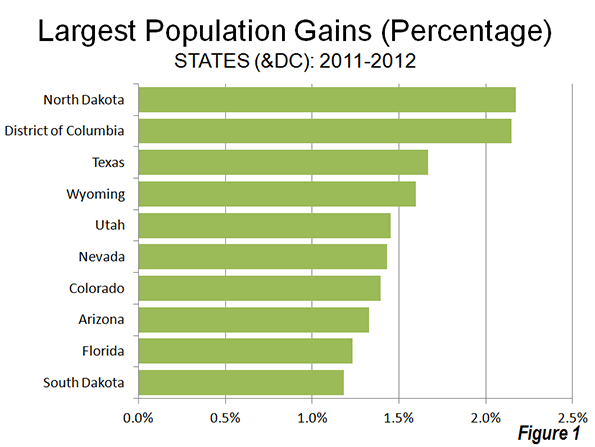
The big surprise was the population growth leader, North Dakota, which has experienced a strong boom in natural resource extraction. Between 1930 and 2010, North Dakota had lost population. However in the first two years of the new decade, North Dakota has experienced strong growth, and reached its population peak, according to the new estimates, in 2012. North Dakota's population growth rate between 2011 and 2012 was 2.17%. Nearby South Dakota also grew rapidly, ranking 10th in population growth. The other fastest-growing states were all in the South or the West. The District of Columbia, located in the strongly growing Washington, DC Metropolitan area ranked second in growth rate behind North Dakota (Figure 1).
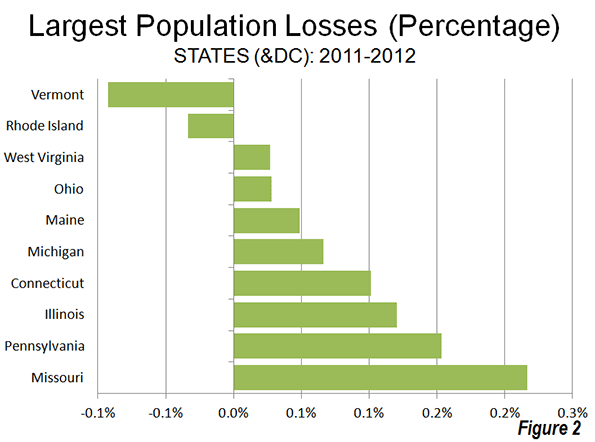
Two states lost population, Vermont and Rhode Island, as the Northeast and Midwest represented all but one of the 10 slowest growing states. West Virginia, in the South, was also included among the slowest growing states (Figure 2).
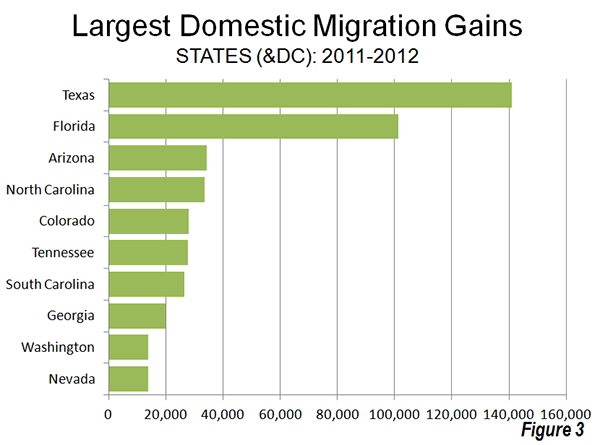
The domestic migration trends continue to favor the South and West. Texas continues to attract the largest number of domestic migrants (141,000), followed by Florida (101,000). These two states have been the domestic migration leaders in the nation every year since 2000 (Figure 3). Four states gained from 25,000 to 35,000 domestic migrants (Arizona, North Carolina, Tennessee and South Carolina).
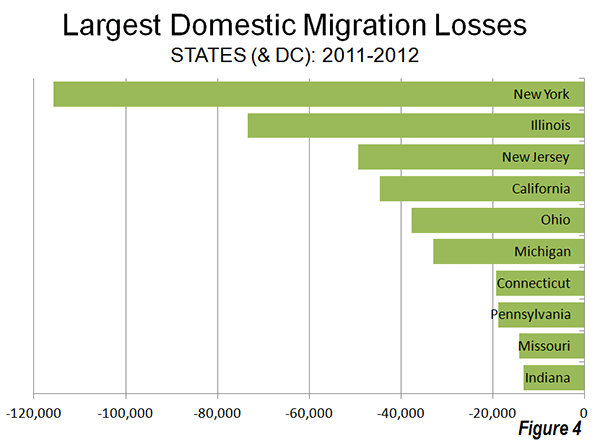
Generally, the same states continued to dominate domestic migration losses, with New York losing the most migrants, Illinois ranking second, followed by California, Ohio and Michigan. With the exception of California, all of the 10 states losing the largest number of domestic migrants were in the Northeast or the Midwest (Figure 4).
Overall, domestic migration continues to be dominated by the South, which attracted 354,000 residents from other states. The West added 52,000 domestic migrants, however virtually all of this gain occurred in the Intermountain West. Gains in Oregon and Washington were far more than offset by the large losses in California, as well as losses in Hawaii and Alaska. The Intermountain West gained more than 70,000 domestic migrants. The Northeast lost 221,000 domestic migrants, while the Midwest lost 185,000.


