
For some years, the University of Minnesota’s Accessibility Observatory has produced major metropolitan area (labor markets) job access estimates for the average worker, at various trip lengths and modes. The latest estimates (2023) cover 50 of the nation’s major metropolitan areas (over 1,000,000 million). Major metropolitan areas not in the 2023 data include Hartford, Honolulu, New Orleans, Omaha, Rochester, Tucson and Tulsa.
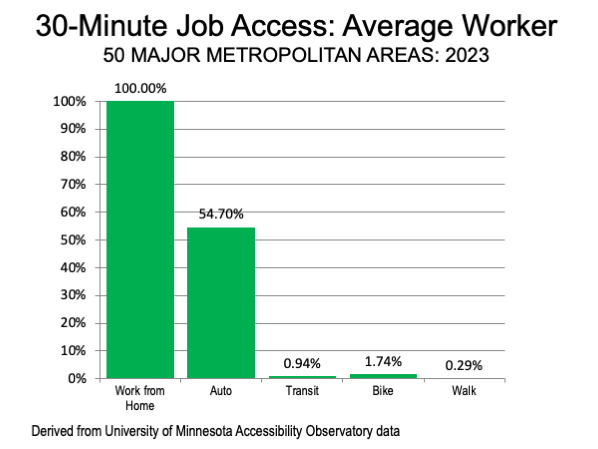
The data indicate auto access to jobs is far greater by car than by transit. This is shown below at the 30-minute job access level, which is slightly more than the average one-way work trip travel time of 26.8 minutes (about 60% of US workers reached work in 30 minutes), according to the American Community Survey. This does not include people who work at home, whose work trip travel time is zero minutes.). If people who work at home (zero minutes travel time) are included, the average one-way work trip travel time in 2024 was 22.9 minutes

The 30-minute standard is used by many planning agencies, with its historic roots. The 30-minute one-way work trip travel time has been called the Marchetti Constant, described by Italian physicist Cesare Marchetti. Jonathan English, writing in City Lab, provides a compelling history from 800 BCE to today.
Auto Access to Metro Area Jobs
The data indicate by far the best 30-minute access to jobs for the average worker is by car in the 50 major metropolitan areas (Table). The unweighted average 30-minute access for major metropolitan area workers is 54.7% of metropolitan area jobs.
The best auto access is in Salt Lake City and San Francisco, where more than 100% of jobs can be reached by car in 30 minutes. These impressive figures are likely made possible by the virtually continuous urban development in adjacent metropolitan areas, which creates a commuter market larger than is defined by the metropolitan area. For example, fully developed continues from the north Salt Lake City metro area boundary to the Ogden metro area, just north of downtown Salt Lake City. In San Francisco, the continuous urbanization spreads to San Jose on both sides of San Francisco Bay.
The least 30-minute job access for autos was in metro New York (14.86%), leading Chicago (22.70%), Atlanta (23.20%), Miami (25.81%) and Los Angeles (25.86%).
Auto Access Compared to Transit: On average automobile commuters can access 58.3 times (5,830%) as many jobs in 30 minutes than by transit in the major metropolitan areas. The five leading major metros in Auto-Transit 30-minute access are Detroit (210.2), Raleigh (160.6), Dallas-Fort Worth (150.1), Birmingham (144,1) and Riverside-San Bernardino (142.4). The major metro with the least 30-minute auto-transit job access is New York (auto access 7.8 times that of transit). This means that throughout the metro area, transit 30-minute job access is 1.3% that of cars. San Francisco (12.6), Boston (18.6), Chicago (22.0), Philadelphia (22.7) and Washington (23.9) round out the major metros with the least 30-minute auto job access compared to transit.
Transit Access to Metro Area Jobs
As noted above, the average transit commuter can reach 0.94% (less than one percent) of the metro area jobs in 30-minutes. The best transit access is in metro San Francisco, where the average commuter can reach 2.98% of the jobs in 30-minutes. In Milwaukee the average commuter can reach 2.66% of the jobs in 30-minutes by transit, followed by Salt Lake City (2.10%), San Jose (1.93%) and New York (1.90%). However, the job access is skewed higher in San Francisco, Salt Lake City and San Jose by virtue of adjacent metro areas that increase the number of jobs that can be reached in 30 minutes.
The least transit 30-minute access was in Riverside-San Bernardino (0.19%), ahead of Atlanta (0.23%), Dallas-Fort Worth (0.24%), Detroit (0.25%) and St. Louis (0.38%).
Bicycle Access to Metro Area Jobs
As noted above, the average bicycle commuter (low stress traffic, as opposed to medium stress) can reach 1.74% of the metro area jobs in 30-minutes. Perhaps surprisingly, this is nearly double the 30-minute access by transit. The best bicycle access is in metro Salt Lake City, where the average commuter can reach 4.43% of the jobs in 30-minutes. In Milwaukee the average commuter can reach 3.81% of the jobs in 30-minutes by transit, followed by Fresno (3.75%), San Francisco (3.67%) and San Jose (3.65%).
The least 30-minute bicycle access was in Atlanta (0.41%), ahead of Dallas-Fort Worth (0.47%), Riverside-San Bernardino (0.48%), Houston (0.51%) and Miami (0.84%).
This low-stress analysis indicates that all of the 5o major metros with the exception of New York have greater 30-minute job access than transit. Even in New York, the low-stress bicycle access(1.85%) is nearly as great as that of New York (1.90). Bicycles at medium stress have better 30-minute access in all 50 markets.
Overall, the average 30-minute auto access to jobs is 31.4 times that of bicycles (low-stress).
Walking Access to Metro Area Jobs
Among the modes included in the University of Minnesota analysis, the least 30-minute job access is by walking (0.29%).
Metro San Francisco has the best 30-minute job access by walking (0.70%), followed by Salt Lake City (0.63%), San Jose (0.60%), Fresno (0.57%) and Buffalo (0.53%). The least 30-minute walking job access was in Atlanta (0.08%), followed closely by Dallas-Fort Worth (0.09%), Riverside-San Bernardino (0.10%), Houston (0.10%) and Detroit (0.11%).
Overall, the average 30-minute auto access to jobs is 189.4 times that of walking.
Rejecting the Unavailable
The media and transit advocates often suggest that people are rejecting transit and commuting by car instead. The plain truth is that for the overwhelming majority of commuters, transit is simply not a viable alternative, due to its miniscule access relative to cars. The last thing that should be concluded from that transit should be expanded. Transit ridership is already concentrated in its best markets, principally to the nation’s largest job centers. Just six cities (municipalities, not metropolitan areas), New York, Chicago, Philadelphia, Boston, San Francisco and Washington account for 60% of transit commute destinations in the US, in comparison with their less than six percent of jobs. Any material increase in transit service is likely to cost much more per passenger. Meanwhile, even the automobile has its limits, as the huge increase in working from home has indicated. Our increasingly digitizing economy could substitute for physical travel in the future.
Wendell Cox is principal of Demographia, an international public policy firm located in the St. Louis metropolitan area. He is a Senior Fellow with Unleash Prosperity in Washington and the Frontier Centre for Public Policy in Winnipeg and a member of the Advisory Board of the Center for Demographics and Policy at Chapman University in Orange, California. He has served as a visiting professor at the Conservatoire National des Arts et Metiers in Paris. His principal interests are economics, poverty alleviation, demographics, urban policy and transport. He is author of the annual Demographia International Housing Affordability Survey and author of Demographia World Urban Areas.
Mayor Tom Bradley appointed him to three terms on the Los Angeles County Transportation Commission (1977-1985), which was a predecessor agency to the Los Angeles County Metropolitan Transportation Authority (Metro). Speaker of the House Newt Gingrich appointed him to the Amtrak Reform Council, to complete the unexpired term of New Jersey Governor Christine Todd Whitman (1999-2002). He is author of War on the Dream: How Anti-Sprawl Policy Threatens the Quality of Life and Toward More Prosperous Cities: A Framing Essay on Urban Areas, Transport, Planning and the Dimensions of Sustainability.
Photo credit: Ted Eytan Flickr under CC 2.0 License.
Table back to reference
| 30-MINUTE JOB ACCESS BY MODE: 50 MAJOR METROS: 2023 | |||||
| JOBS ACCESSIBLE IN 30-MINUTES: 2023 | CAR JOB ACCESS OVER TRANSIT |
||||
| Market (Metropolitan Area) | CAR | TRANSIT | BIKE | WALK | |
| Atlanta | 23.20% | 0.23% | 0.41% | 0.08% | 100.6 |
| Austin | 59.96% | 0.92% | 1.96% | 0.33% | 65.4 |
| Baltimore | 52.72% | 1.21% | 1.82% | 0.29% | 43.7 |
| Birmingham | 57.76% | 0.40% | 1.28% | 0.24% | 144.1 |
| Boston | 28.38% | 1.53% | 2.32% | 0.42% | 18.6 |
| Buffalo | 79.07% | 1.68% | 2.96% | 0.53% | 47.1 |
| Charlotte | 38.10% | 0.45% | 0.94% | 0.18% | 84.6 |
| Chicago | 22.70% | 1.03% | 1.18% | 0.24% | 22.0 |
| Cincinnati | 55.99% | 0.58% | 1.14% | 0.19% | 96.4 |
| Cleveland | 62.49% | 0.77% | 1.35% | 0.22% | 81.5 |
| Columbus | 71.75% | 0.94% | 1.74% | 0.27% | 76.0 |
| Dallas-Fort Worth | 36.63% | 0.24% | 0.47% | 0.09% | 150.1 |
| Denver | 67.02% | 1.26% | 2.72% | 0.41% | 53.1 |
| Detroit | 53.27% | 0.25% | 0.86% | 0.11% | 210.2 |
| Fresno | 70.24% | 1.45% | 3.75% | 0.57% | 48.6 |
| Grand Rapids | 69.40% | 1.40% | 2.63% | 0.38% | 49.7 |
| Houston | 29.80% | 0.39% | 0.51% | 0.10% | 76.2 |
| Indianapolis | 62.25% | 0.61% | 1.38% | 0.22% | 101.9 |
| Jacksonville | 53.79% | 0.40% | 0.88% | 0.20% | 133.7 |
| Kansas City | 67.70% | 0.50% | 1.52% | 0.22% | 135.2 |
| Las Vegas | 89.42% | 0.77% | 1.90% | 0.29% | 116.1 |
| Los Angeles | 25.86% | 0.58% | 0.89% | 0.15% | 44.8 |
| Louisville | 73.24% | 0.93% | 2.24% | 0.28% | 78.6 |
| Memphis | 81.40% | 0.79% | 1.78% | 0.31% | 103.4 |
| Miami | 25.81% | 0.52% | 0.84% | 0.18% | 50.1 |
| Milwaukee | 86.56% | 2.66% | 3.81% | 0.52% | 32.6 |
| Minneapolis | 58.01% | 0.81% | 1.77% | 0.21% | 71.7 |
| Nashville | 37.15% | 0.64% | 1.35% | 0.23% | 58.5 |
| New York | 14.86% | 1.90% | 1.85% | 0.33% | 7.8 |
| Oklahoma City | 72.45% | 0.65% | 2.27% | 0.31% | 111.8 |
| Orlando | 55.22% | 0.39% | 0.85% | 0.17% | 139.9 |
| Philadelphia | 26.07% | 1.15% | 1.27% | 0.22% | 22.7 |
| Phoenix | 48.36% | 0.46% | 1.10% | 0.14% | 105.9 |
| Pittsburgh | 31.68% | 0.88% | 1.20% | 0.20% | 36.0 |
| Portland | 55.34% | 1.55% | 2.79% | 0.41% | 35.6 |
| Providence | 51.21% | 1.15% | 1.71% | 0.40% | 44.5 |
| Raleigh | 89.62% | 0.56% | 1.65% | 0.28% | 160.6 |
| Richmond | 72.49% | 1.07% | 2.33% | 0.38% | 68.0 |
| Riverside-San Bernardino | 26.52% | 0.19% | 0.48% | 0.10% | 142.4 |
| Sacramento | 60.13% | 0.79% | 1.94% | 0.32% | 76.1 |
| Salt Lake City | 127.42% | 2.10% | 4.43% | 0.63% | 60.8 |
| San Antonio | 59.98% | 0.60% | 1.14% | 0.18% | 99.2 |
| San Diego | 51.37% | 0.64% | 1.20% | 0.26% | 80.5 |
| San Francisco | 36.70% | 2.98% | 3.67% | 0.70% | 12.3 |
| San Jose | 110.73% | 1.93% | 3.65% | 0.60% | 57.3 |
| Seattle | 38.57% | 1.56% | 2.54% | 0.49% | 24.7 |
| St. Louis | 52.16% | 0.38% | 0.95% | 0.16% | 136.8 |
| Tampa-St. Petersburg | 39.25% | 0.48% | 1.03% | 0.18% | 82.3 |
| Virginia Beach | 49.48% | 0.47% | 1.09% | 0.24% | 104.4 |
| Washington | 27.50% | 1.15% | 1.56% | 0.27% | 23.9 |
| Average (unweighted) | 54.74% | 0.94% | 1.74% | 0.29% | 58.3 |
| Derived from University of Minnesota data | |||||
| Attachment | Size |
|---|---|
| access-umn-2023.png | 39.46 KB |


