
Late in 2012, the Brookings Institution published its annual Global Metro Monitor (by Emilia Istrate and Carey Anne Nadeau), which estimates economic data for the 300 world metropolitan areas with the largest gross domestic product (GDP). The Global Metro Monitor also provides estimates of the GDP per capita for each of the qualifying metropolitan areas. The surprising news: after at least five years of the most laggard economic performance in adult memory, the United States continues to dominate the highest GDP per capita data.
Summary by Geography
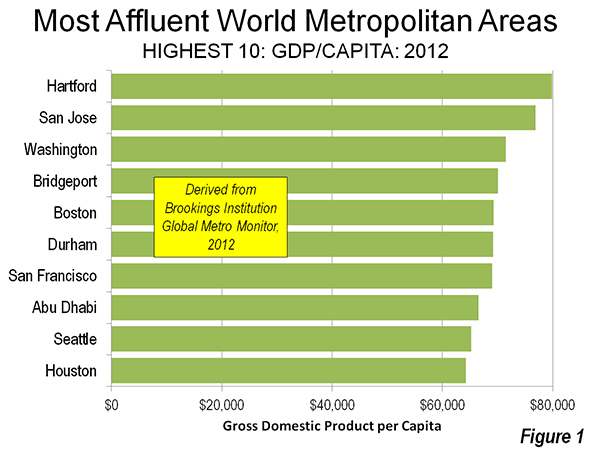
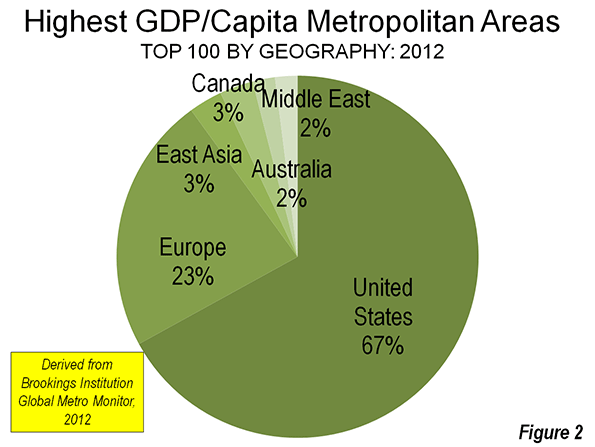
Among the 10 metropolitan areas with the highest GDP per capita, nine are in the United States (Figure 1). Hartford ($79,900 per capita), for the second year in a row, was ranked the most affluent metropolitan economy by Brookings. The US accounts for 36 of the top 50 metropolitan economies, and 67 of the top 100.
Europe is also strongly represented, with 23 of the most affluent 100 economies as rated by Brookings. Yet for the most part European metropolitan regions were concentrated between 50th and 100th. Only seven European metropolitan areas made the top 50. The highest ranking was Edinburgh, Scotland ($59,400), at 21st. Two former East Bloc European metropolitan economies also broke into the top 100, Prague at 70th and Moscow at 92nd.
East Asia placed 3 metropolitan areas in the top 100. Singapore ($62,500) did best at 14th. Singapore's ranking behind so many US metropolitan areas may be surprising, since Singapore has a higher GDP per capita than the United States. However, the most affluent US metropolitan areas are more affluent than Singapore, which is both a city and a country. The highest ranking Chinese metropolitan area was Macau, the former Portuguese Special Administrative Region, which ranked 26th.
No mainland Chinese metropolitan area was in the top 100. However, should China's economic growth continue at its fast pace, it will not be long before the most affluent metropolitan areas break into the top 100. The strongest candidates could be Suzhou and Wuxi (between Shanghai and Nanjing) and Hong Kong neighbor Shenzhen (Note).
Two Middle Eastern metropolitan economies were represented in the top 100, both in the top 50. Oil-rich Abu Dhabi ($66,500) was the only metropolitan area outside the United States to place in the top 10, ranking 8th, while Kuwait City ($56,100) ranked 32nd.
Three of Canada's largest metropolitan areas made the list, led by Calgary ($61,600), which ranked 15th, while Edmonton ($52,000) rounded out the top 50. Two of Australia's largest metropolitan areas were represented. The most affluent was Perth ($63,400), which ranked 11th and was the second ranking metropolitan area outside the United States (Figure 2). Perth was also the only Australian metropolitan area to rank in the top 50.
None of the metropolitan areas of Latin America, South Asia (such as India or Indonesia) or Africa was ranked in the top 100.
Highlights: Metropolitan Area Highlights
Some of the metropolitan areas that might have been expected to be ranked the highest were instead well down on the list.
This is particularly evident with respect to the large financial centers. New York ranked 12th, behind Perth and immediately ahead of Des Moines, which experienced the greatest percentage growth in financial sector jobs in the United States over the last five years (See: The Dispersion of Financial Center Jobs). Other principal financial centers were ranked even lower, London was ranked 51st, behind its perennial competitor, Paris, which was 43rd.
Other money centers did even worse, with Frankfurt 53rd, Hong Kong 65th, and Tokyo 112th. Canada's principal financial center, Toronto, was ranked 96th, well behind Calgary and Edmonton (but ahead of Ottawa at 108th, Vancouver at 114th, and Montreal at 150th). Australia's leading financial center, Sydney, was ranked 88th, far behind Perth but ahead of Melbourne (113th).
Information technology centers were well represented in the top 10, including San Jose (2nd), Boston (5th), Durham, home to most of Research Triangle Park (6th), San Francisco (7th), and Seattle (9th).
The high rankings of Abu Dhabi, Perth, Calgary, as well as Houston (10th), Kuwait City (32nd), Oslo (34th) and Edmonton (50th) demonstrate the importance of natural resources to metropolitan economies.
GDP Per Capita and Urban Population Density
There has been considerable confusion about cities, productivity and population density. For example, the urban scaling research of the Santa Fe Institute has been misinterpreted to indicate that higher density cities are more productive. In fact, the research specifically denies any such relationship, finding that productivity generally rises simply as a function of higher metropolitan populations (see Density is not the Issue: The Urban Scaling Research). Further, it has often been suggested that as cities grow they become more dense. In contrast, the evidence is overwhelming that cities tend to become less dense as they grow (see The Evolving Urban Form).
Supplementing the Brookings Institution GDP per capita estimates with population density estimates (from Demographia World Urban Areas) provides further indication that greater affluence is not associated with higher population density.
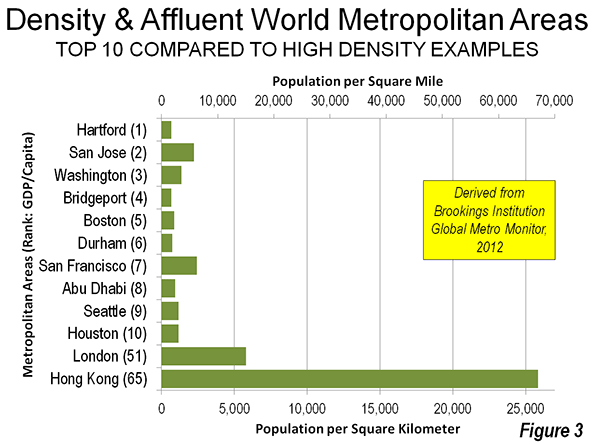
For example, Hartford, with the highest GDP per capita of all 300 metropolitan areas covered by Brookings has an urban area density (1,800 per square mile or 7000 per square kilometer) similar to that of Atlanta, the least dense urban area in the world with more than 2 million population. Bridgeport and Durham (North Carolina) have similarly low densities and are ranked in the top 10. San Jose (5,800 per square mile or 2,200 per square kilometer) and San Francisco (6,300 per square mile or 2,400 per square kilometer) have the highest density urban areas among the 10 most affluent metropolitan areas, though their densities are low to middling by European standards and well below East Asian densities (Figure 3).
Out of the 100 most affluent metropolitan areas (Figure 4), 35 have population densities under 2,500 per square mile (1,000 per square kilometer). Many have very low densities, with 17 have density similar to or lower than Atlanta (such as Knoxville, TN, Little Rock, AR, Worcester, MA and Columbia, SC).
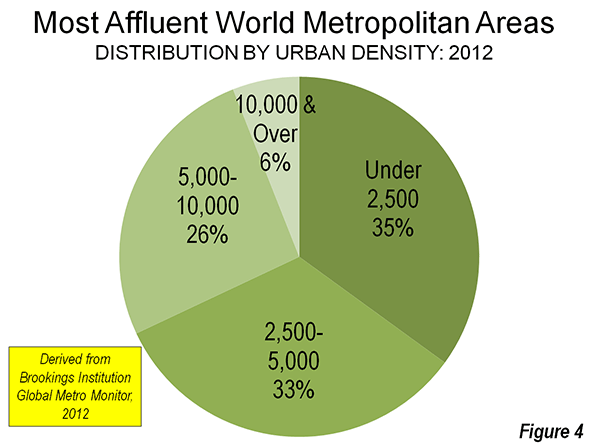
Another 33 metropolitan areas have urban densities between 2,500 and 5,000 per square mile (1,900 per square kilometer). This includes metropolitan areas such as Denver, Perth, Dallas-Fort Worth, Houston, Vancouver, Portland and Seattle. There are also 26 metropolitan areas with between 5000 and 10,000 per square mile (3,900 per square mile), such as Los Angeles, Paris, Stockholm, Toronto and Vienna. There were only six metropolitan areas with urban densities above 10,000 per square mile (3,900 per square kilometer), Macau, Hong Kong, Singapore, London, Kuwait City and Prague.
The Future?
The continued strong showing of the United States in the world affluent metropolitan area league tables cannot be taken for granted. While it seems likely that US metropolitan areas will not be displaced by their European counterparts, the strong growth in Canada and Australia could propel their metropolitan areas much higher. And then, there is always China and other increasingly affluent cities of east Asia.
Wendell Cox is a Visiting Professor, Conservatoire National des Arts et Metiers, Paris and the author of “War on the Dream: How Anti-Sprawl Policy Threatens the Quality of Life.”
-----
Note: The GDP per capita of metropolitan areas in China is adjusted, using the population figures from the 2010 census (which included the urban migrant population). The issue is described in Endnote 19 in the Brookings Global Metro Monitor.


