For our War of the Regions piece I went through BLS data and calculated location quotients for a few key diverging industries, namely manufacturing and securities, commodities and investments side of the finance industry. These are the kind of numbers that really benefit from geographic visualization.
A LQ tells us not where the most jobs are in any given industry, but how much of a state's employment is clustered in the given industry.
I've been following FortiusOne for a while but this is the first time I've gotten a chance to play around with their GEOCommons Finder! and Maker!, a new social production platform for agglomerating, sharing and visualizing geographic data. It's a fantastic platform.
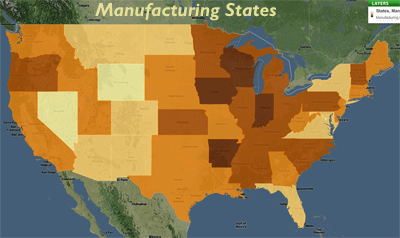 Click on the map images here to explore them on the GEOCommons platform. You can see a lot of dark color in the rust belt, but at this point, the states of Indiana, Wisconsin, Arkansas, Iowa, Alabama, and Mississippi are at or ahead of Michigan and Ohio in state dependence on Manufacturing. Part of this is due to growth in the South and Great Plains, and part is due to manufacturing job losses in the Rust Belt, causing the concentration there to slip.
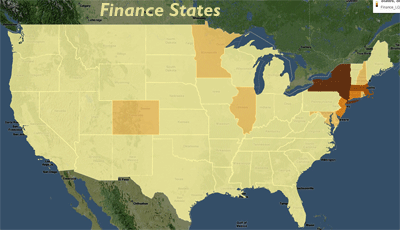 Finance here is limited to Securities, Commodity Contracts, and Other Financial Investments and Related Activities (NAICS 523). Not surprisingly, this industry is clustered in the Northeast. You see Illinois, Minnesota, and Colorado shaded darker due to the role of Chicago, Minneapolis, and Denver as regional trade centers.
Take some time to explore GEOCommons and some of the other visualizations created by others, and watch for more maps in this space as we do the same.


